. 2011 Mar 4;286(9):7070-81.
doi: 10.1074/jbc.M110.171256. Epub 2010 Dec 30.

Complement receptor Mac-1 is an adaptor for NB1 (CD177)-mediated PR3-ANCA neutrophil activation

Affiliations

Complement receptor Mac-1 is an adaptor for NB1 (CD177)-mediated PR3-ANCA neutrophil activation

Uwe Jerke et al. J Biol Chem. .

Abstract

The glycosylphosphatidylinositol (GPI)-anchored neutrophil-specific receptor NB1 (CD177) presents the autoantigen proteinase 3 (PR3) on the membrane of a neutrophil subset. PR3-ANCA-activated neutrophils participate in small-vessel vasculitis. Since NB1 lacks an intracellular domain, we characterized components of the NB1 signaling complex that are pivotal for neutrophil activation. PR3-ANCA resulted in degranulation and superoxide production in the mNB1(pos)/PR3(high) neutrophils, but not in the mNB1(neg)/PR3(low) subset, whereas MPO-ANCA and fMLP caused similar responses. The NB1 signaling complex that was precipitated from plasma membranes contained the transmembrane receptor Mac-1 (CD11b/CD18) as shown by MS/MS analysis and immunoblotting. NB1 co-precipitation was less for CD11a and not detectable for CD11c. NB1 showed direct protein-protein interactions with both CD11b and CD11a by surface plasmon resonance analysis (SPR). However, when these integrins were presented as heterodimeric transmembrane proteins on transfected cells, only CD11b/CD18 (Mac-1)-transfected cells adhered to immobilized NB1 protein. This adhesion was inhibited by mAb against NB1, CD11b, and CD18. NB1, PR3, and Mac-1 were located within lipid rafts. In addition, confocal microscopy showed the strongest NB1 co-localization with CD11b and CD18 on the neutrophil. Stimulation with NB1-activating mAb triggered degranulation and superoxide production in mNB1(pos)/mPR3(high) neutrophils, and this effect was reduced using blocking antibodies to CD11b. CD11b blockade also inhibited PR3-ANCA-induced neutrophil activation, even when β2-integrin ligand-dependent signals were omitted. We establish the pivotal role of the NB1-Mac-1 receptor interaction for PR3-ANCA-mediated neutrophil activation.


Figures
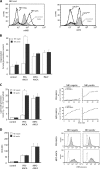
FIGURE 1.
FIGURE 1.
Degranulation, NADPH oxidase-dependent ferricytochrome c reduction and intracellular DHR oxidation in NB1neg and NBpos neutrophils. Neutrophils from mNB1 and mPR3 bimodal donors (unsorted cells) were separated by magnetic cell sorting using an anti-NB1 mab. Sorting resulted in two distinct subsets that are NB1neg and NB1pos as well as mPR3low and mPR3high. Typical flow cytometry examples are depicted (panel A). The mNB1neg/mPR3low and mNB1pos/mPR3high subsets were then primed with TNF-α and subsequently stimulated with IgG from 2 different patients with PR3-ANCA or MPO-ANCA, or from normal (control). Incubation with fMLP was done for comparison. Degranulation is shown in panel B (n = 3). Ferricytochrome c reduction is shown in panel C (n = 6). Bars for ferricytochrome c measurements on the left depict superoxide generation at 45 min with a typical example for the time course up to 60 min on the right. DHR oxidation is shown in panel D (n = 6). Bars for DHR oxidation on the left depict data after 30 min stimulation with typical histograms on the right. * indicates significant activation of mNB1pos/mPR3high neutrophils when compared with the mNB1neg/mPR3low cells (p < 0.05).
FIGURE 2.
FIGURE 2.
NB1 is co-immunoprecipitated with Mac-1 from digitonin extracts of plasma membrane preparations. Neutrophil plasma membranes were prepared and assayed for the membrane marker alkaline phosphatase and the granule marker MPO (panel A). Membrane fractions were then solubilized with digitonin. The presence of NB1 and PR3 in the membrane extracts was confirmed by Western blotting (panel B). NB1 was precipitated from neutrophil membranes using an affinity matrix. The eluted material was analyzed using tandem mass spectrometry analysis (MS/MS). CD11b and CD18 were identified with typical MS characteristics shown in panels C and D. Immunoprecipitated NB1 complexes were probed for CD11a, CD11b, CD11c, CD18, and NB1 using specific antibodies and Western blot analysis (panel E). Instead of an anti-NB1 antibody (αNB1), an isotype control (Iso), and beads not coupled to an antibody (empty) were used as negative controls. Digitonin extracts were used as positive control.
FIGURE 3.
FIGURE 3.
Characterization of NB1 interactions with CD11b/CD18 and CD11a/CD18. Panel A, protein-protein interaction was analyzed by SPR. Recombinant CD11b, CD11a, or αIIb-β3 was immobilized on a sensor chip. NB1 protein at a concentration of 0.5 μm was injected wit a flow rate 20 μl/min at 25°. Protein-protein interaction was recorded as relative response unit (RU) for 300 s. Panels B and C, a cell adhesion assay was performed. Panel B, CD11b/CD18 (Mac-1)-transfected (gray columns) and αIIb-β3-transfected cells (white columns) were added to 96-well plates coated with purified NB1 or BSA for 30 min as indicated. Cell adhesion was measured in the presence of two different anti-NB1 mAbs (αNB1, 7D8, MEM166), two different anti-CD11b (αCD11b, 2LPM19c, ICRF44), anti-CD11a (αCD11b, HI111), and anti-CD18 mAb (αCD18, IB4). Note the significant inhibitory capacity of the MEM166 mAb and the mAbs against CD11b and CD18. Panel C, CD11a/CD18 (LFA-1)-transfected (gray columns) and mock-transfected cells (white columns) were added to 96-well plates coated with purified BSA, NB1, or ICAM-1 protein (10 μg/ml) for 30 min as indicated. After washing twice, no significant adhesion of LFA-1-transfected cells to coated NB1 was observed when compared with coated ICAM-1 (positive control). In addition, anti-LFA-1 mAbs significantly blocked cell adhesion to immobilized ICAM-1. n = 4, * indicates p < 0.05.
FIGURE 4.
FIGURE 4.
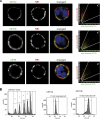
NB1 strongly co-localizes with CD11b and CD18 on the neutrophil membrane, and CD11b shows higher expression on the neutrophil membrane compared with CD11a. Panel A, confocal microscopy was performed. Neutrophils were stained for NB1 (red) or for CD11a, CD11b, and CD18, respectively (green). DAPI staining indicates the nuclei in blue. Overlay images demonstrate co-localization of green and red-stained molecules by a shift toward yellow color. Scattergrams in the right panel of each row show the amount of co-localizing pixels in region C after threshold and background correction. The data show a high amount of co-localizing pixels for NB1/CD11b and NB1/CD18. In contrast, only a few co-localizing pixels are found for NB1 and CD11a. 14 to 19 cells were analyzed in each of two independent experiments. Panel B, cell surface expression of CD11a and CD11b was assessed by flow cytometry. The data demonstrate that ∼5-fold more CD11b molecules are expressed on the neutrophil membrane compared with CD11a.
FIGURE 5.
FIGURE 5.
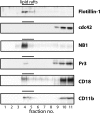
NB1 exists together with Mac-1 and PR3 in lipid rafts. Neutrophil plasma membranes were lyzed and subjected to sucrose density gradient centrifugation. By Western blot analysis, the resulting fractions were probed with specific antibodies to the indicated molecules. Plasma membrane fraction 4 shows the highest amount of the lipid raft marker flotillin-1 in the absence of the non-lipid raft marker Cdc42. Both NB1 and PR3 were also detected in these lipid rafts. One of two similar experiments is depicted.
FIGURE 6.
FIGURE 6.
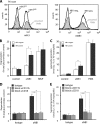
NB1 mediates degranulation and superoxide generation in a Mac-1-dependent fashion. Neutrophils from mNB1/mPR3 bimodal donors were separated by magnetic cell sorting using an anti-PR3 mAb. Sorting resulted in two distinct subsets that are either mNB1neg and mNB1pos or mPR3low and mPR3high. A typical flow cytometry example is depicted (panel A). The mNB1neg/mPR3low and mNB1pos mPR3high subsets were then primed with TNF-α and subsequently stimulated with anti-NB1 mAb MEM166 (αNB1) or an isotype control (control). Incubation with fMLP and PMA was done for comparison. The anti-NB1 mAb induced degranulation (panel B, n = 4), ferricytochrome c reduction (panel C, n = 8) only in mNB1pos/mPR3high neutrophils. Blockade of CD11b and CD18 was performed in unsorted cells. Cells were incubated with the blocking antibodies for 30 min, followed by TNF-α priming and anti-NB1 mAb incubation. CD11b and CD18 blockade prevented NB1-mediated degranulation (panel D, n = 3) and superoxide generation (panel E, n = 6). * indicates significant inhibition (p < 0.05).
FIGURE 7.
FIGURE 7.
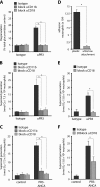
Mac-1 blockade abrogates degranulation and superoxide generation induced by anti-PR3 antibodies in a ligand-independent fashion. Neutrophils were preincubated for 30 min with blocking mabs to CD11b, CD18, and isotype control, respectively. After TNF-α priming, cells were treated with mabs to PR3 (αPR3) or isotype control (panels A, B, and E) or with IgG from 2 different patients with PR3-ANCA or human controls (panels C and F). Degranulation (panel A, n = 3) and ferricytochrome c reduction (panels B and C, n = 6) were measured. Blocking mAb to CD11b, CD18, but not an isotype control significantly reduced activation of TNF-α-primed neutrophils in response to mabs to PR3 and PR3-ANCA from patients. Neutrophil adhesion on a plastic and an ultra-low adhesion surface in parallel (panel D, n = 7). 5 × 10⁵ neutrophils were stimulated with 2 ng/ml TNF-α. After 45 min., wells were washed and adherent cells were estimated by the MPO activity assay. Neutrophils on ultra-low attachment plates were preincubated with blocking mabs to CD11b, CD18, and isotype control, respectively. After TNF-α priming, cells were treated with mabs to PR3 (panel E, n = 7) or with IgG from 2 different patients with PR3-ANCA patients (panel F, n = 5). Appropriate isotype control antibodies (isotype) and IgG preparations from normal (control) were used for comparison. Adhesion and ferricytochrome c reduction was measured in parallel. * indicates p < 0.05.

Similar articles

Cited by

References

    1. van der Woude F. J., Rasmussen N., Lobatto S., Wiik A., Permin H., van Es L. A., van der Giessen M., van der Hem G. K., Hauu The T. (1985) Lancet i, 425–429 - PubMed
    1. Falk R. J., Jennette J. C. (1988) N. Engl. J. Med. 318, 1651–1657 - PubMed
    1. Falk R. J., Terrell R. S., Charles L. A., Jennette J. C. (1990) Proc. Natl. Acad. Sci. U.S.A. 87, 4115–4119 - PMC - PubMed
    1. Savage C. O., Pottinger B. E., Gaskin G., Pusey C. D., Pearson J. D. (1992) Am. J. Pathol. 141, 335–342 - PMC - PubMed
    1. Xiao H., Heeringa P., Hu P., Liu Z., Zhao M., Aratani Y., Maeda N., Falk R. J., Jennette J. C. (2002) J. Clin. Invest. 110, 955–963 - PMC - PubMed

Publication types

MeSH terms