. 2011 Feb 1;27(3):391-8.
doi: 10.1093/bioinformatics/btq670. Epub 2010 Dec 30.

Principal network analysis: identification of subnetworks representing major dynamics using gene expression data

Affiliations

Principal network analysis: identification of subnetworks representing major dynamics using gene expression data

Yongsoo Kim et al. Bioinformatics. .

Abstract

Motivation: Systems biology attempts to describe complex systems behaviors in terms of dynamic operations of biological networks. However, there is lack of tools that can effectively decode complex network dynamics over multiple conditions.

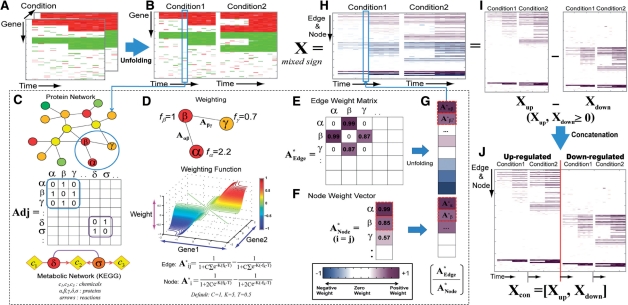
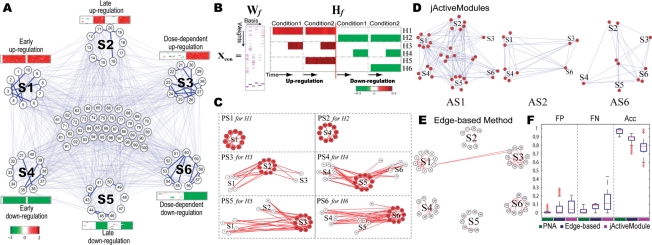
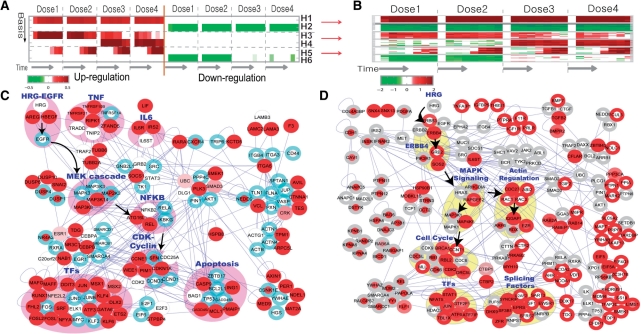
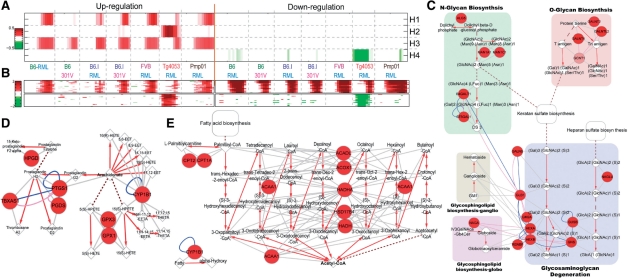
Results: We present principal network analysis (PNA) that can automatically capture major dynamic activation patterns over multiple conditions and then generate protein and metabolic subnetworks for the captured patterns. We first demonstrated the utility of this method by applying it to a synthetic dataset. The results showed that PNA correctly captured the subnetworks representing dynamics in the data. We further applied PNA to two time-course gene expression profiles collected from (i) MCF7 cells after treatments of HRG at multiple doses and (ii) brain samples of four strains of mice infected with two prion strains. The resulting subnetworks and their interactions revealed network dynamics associated with HRG dose-dependent regulation of cell proliferation and differentiation and early PrPSc accumulation during prion infection.

Availability: The web-based software is available at: http://sbm.postech.ac.kr/pna.


Figures

Fig. 1.
Fig. 1.
Construction of an activation weight matrix. PNA first transforms multi-dimensional expression data into log2-fold changes (A) and unfolds it into a two-dimensional matrix (B). We then represent the edges with the adjacency matrix Adj (C). Using a weighting function (D), the PNA then computes both edge (A*Edge) and node (A*Node) activity weights (E and F), unfolds the A*Edge into a vector and concatenates it with A*Node, resulting in a weight vector for each condition (G and H). For the ONMF analysis, we represented the activity weight matrix (X) with X = XupXdown (I) and then concatenated Xup and Xdown to result in Xcon = [Xup, Xdown] (J).
Fig. 2.
Fig. 2.
A PNA application to the synthetic data. Six differential expression patterns were assigned to the nodes in the synthetic network (A). ONMF correctly captured the six differential expression patterns (B). The resulting PSs successfully represented the activation patterns in the synthetic data (C). We also obtained the active subnetworks using jActiveModules (D) and the edge-based method (E) and then compared the performance of PNA with those of the other two methods using FP, FN and accuracy (Acc) (F). See the text for details.
Fig. 3.
Fig. 3.
Application of PNA to the gene expression data from HRG-treated MCF cells. ONMF captured six activation patterns in the data (A). Differential expression of the top 20 genes is well-correlated with the activation patterns in A (B). To investigate HRG dose dependent dynamics, we reconstructed the PS for H5 (HRG dose-dependent activation) using the selected nodes (red) and edges (C). The blue boundary indicates that the corresponding node also belongs to PS1. We then explored the interactions between two PSs for H6 (low-dose specific down-regulation; red nodes) and H4 (high-dose specific up-regulation; red boundary) (D). See the text for details.
Fig. 4.
Fig. 4.
Application of PNA to gene expression data from prion-infected tissues. The results show four strain-combination-dependent activation patterns (A), as well as differential expression patterns of top 20 genes in each basis (B). Both PS (Supplementary Figure S9) and PMS (Supplementary Figure S10) for basis 1 (early PrPsc accumulation) using the significant nodes (red) and edges were reconstructed. Three pathways of the PMS (GAGs, fatty acids and arachidonates to prostaliandins; C–E), previously reported to be associated with PrPsc accumulation are shown. The round, diamond and octagon nodes indicate proteins, metabolitess and glycans, respectively. Red arrows indicate metabolic reactions, and gray edges indicate interactions between enzymes and either substrates or products. See the text for details.

References

    1. Badea L. Proceedings of the European Conference on Machine Learning(ECML-2005). Porto, Portugal: 2005. Clustering and metaclustering with nonnegtaive matrix decompositions; pp. 10–22.
    1. Belich MP, et al. TPL-2 kinase regulates the proteolysis of the NF-kappaB-inhibitory protein NF-kappaB1 p105. Nature. 1999;397:363–368. - PubMed
    1. Brunet JP, et al. Metagenes and molecular pattern discovery using matrix factorization. Proc. Natl Acad. Sci. USA. 2004;101:4164–4169. - PMC - PubMed
    1. Foehr ED, et al. NF-kappa B signaling promotes both cell survival and neurite process formation in nerve growth factor-stimulated PC12 cells. J. Neurosci. 2000;20:7556–7563. - PMC - PubMed
    1. Guo Z, et al. Edge-based scoring and searching method for identifying condition-responsive protein-protein interaction sub-network. Bioinformatics. 2007;23:2121–2128. - PubMed

Publication types