. 2011 Feb;25(2):315-26.
doi: 10.1210/me.2010-0309. Epub 2010 Dec 30.

PERK activation at low glucose concentration is mediated by SERCA pump inhibition and confers preemptive cytoprotection to pancreatic β-cells

Affiliations

PERK activation at low glucose concentration is mediated by SERCA pump inhibition and confers preemptive cytoprotection to pancreatic β-cells

Claire E Moore et al. Mol Endocrinol. 2011 Feb.

Abstract

Protein kinase R-like ER kinase (PERK) is activated at physiologically low glucose concentrations in pancreatic β-cells. However, the molecular mechanisms by which PERK is activated under these conditions and its role in β-cell function are poorly understood. In this report, we investigated, in dispersed rat islets of Langerhans and mouse insulinoma-6 (MIN6) cells, the relationship between extracellular glucose concentration, the free endoplasmic reticulum (ER) calcium concentration ([Ca(2+)](ER)) measured directly using an ER targeted fluorescence resonance energy transfer-based calcium sensor, and the activation of PERK. We found that a decrease in glucose concentration leads to a concentration-dependent reduction in [Ca(2+)](ER) that parallels the activation of PERK and the phosphorylation of its substrate eukaryotic initiation factor-2α. We provide evidence that this decrease in [Ca(2+)](ER) is caused by a decrease in sarcoplasmic/ER Ca(2+)-ATPase pump activity mediated by a reduction in the energy status of the cell. Importantly, we also report that PERK-dependent eukaryotic initiation factor-2α phosphorylation at low glucose concentration plays a significant role in 1) the regulation of both proinsulin and global protein synthesis, 2) cell viability, and 3) conferring preemptive cytoprotection against ER stress. Taken together, these results provide evidence that a decrease in the ATP/energy status of the cell in response to a decrease in glucose concentration results in sarcoplasmic/ER Ca(2+)-ATPase pump inhibition, the efflux of Ca(2+) from the ER, and the activation of PERK, which plays an important role in both pancreatic β-cell function and survival.


Figures

Fig. 1.
Fig. 1.
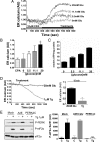
Physiologically relevant decreases in glucose concentration causes [Ca2+]ER depletion and PERK activation in MIN6 cells and islets of Langerhans. Panel A, [Ca2+]ER was measured in intact MIN6 cells using the D1ER cameleon probe. Cells were incubated with KRB containing 20 mm glucose (Glu) before being incubated with KRB in the presence of 11.1, 5.5, or 0 mm glucose. Quantitative comparison of the [Ca2+]ER levels compared with control (20 mm glucose). Results are from three separate experiments (five to 15 cells per experiment) shown as mean ± sem; n = 3. *, P < 0.05. P value was obtained using a one-way ANOVA followed by Bonferroni posttests compared with control (20 mm glucose). Panel B, MIN6 cells were preincubated in KRB containing 20 mm glucose for 1 h. Cells were then treated with KRB supplemented with the indicated concentrations of glucose for 1 h. Proteins were resolved on SDS-PAGE and Western blotted using antisera against phospho-PERK (P-PERK) (Thr980), phospho-eIF2α (P-eIF2α) (Ser51), and total eIF2α as a loading control. Quantified Western blots of phospho-eIF2α are shown as mean ± sem; n = 3.*, P < 0.05; **, P < 0.01. P value was obtained using a one-way ANOVA followed by Bonferroni posttests compared with control (20 mm glucose). Panel C, Time course of PERK activation. MIN6 cells were preincubated in KRB containing 20 mm glucose for 1 h. Cells were then treated with KRB in the absence of glucose for the times indicated in the figure. Proteins were resolved on SDS-PAGE and Western blotted using antisera against phospho-PERK (Thr980), phospho-eIF2α (Ser51), and total eIF2α as a loading control. Panel D, MIN6 cells were infected with Ad-Empty (AdE) or Ad-PERKΔC for 48 h. After infection, the cells were preincubated in KRB in the presence of 20 mm glucose for 1 h. Cells were then treated for an additional 1 h in KRB containing 20 mm glucose [control (C)] or in the absence of glucose (0 mm). Proteins were resolved on SDS-PAGE and Western blotted using antisera against phospho-PERK (Thr980), phospho-eIF2α (Ser51), and total eIF2α as a loading control. Panel E, [Ca2+]ER was measured in dispersed islets using the D1ER cameleon probe. Cells were treated with KRB containing 16.7 mm glucose before being treated with KRB in the presence of 2.8 mm glucose. Quantitative comparison was made of the [Ca2+]ER levels induced by glucose deprivation compared with control (16.7 mm glucose) and analyzed via Student's t test, unpaired and two tailed; *, P < 0.05 results are from three separate experiments (three to eight cells per experiment). Panel F, Islets were incubated at 2.8 or 16.7 mm glucose. Proteins were resolved on SDS-PAGE and Western blotted using antisera against phospho-PERK (Thr980), phospho-eIF2α (Ser51), and total eIF2α as a loading control.
Fig. 2.
Fig. 2.
SERCA is inhibited by a decrease in glucose concentration, and SERCA pump inhibition leads to PERK activation. Panel A, [Ca2+]ER was measured in intact MIN6 cells using the D1ER cameleon probe. To monitor the rate of [Ca2+]ER refilling, the ER store was depleted of Ca2+ by incubating cells in KRB containing 20 mm glucose and 10 μm CPA for 15 min. Cells were then perfused with KRB containing 0, 5.5, 11.1, and 20 mm glucose. Panel B, Quantitative comparison of the [Ca2+]ER levels. Results are from three separate experiments (five to 15 cells per experiment) shown as mean ± sem; n = 3.*, P < 0.05. P value was obtained using a one-way ANOVA followed by Bonferroni posttests compared with control (20 mm glucose). Panel C, MIN6 cells were incubated with KRB containing 20 mm glucose before being incubated with KRB in the presence of 11.1, 5.5, or 0 mm glucose for 15 min. ATP content is expressed as nanomoles of ATP per milligram of total protein shown as mean ± sem; n = 3. P < 0.0001 as determined using one-way ANOVA. Panel D, [Ca2+]ER was measured in intact MIN6 cells treated with 20 mm glucose in the presence or absence of 1 μm thapsigargin. Quantitative comparison of the [Ca2+]ER levels induced by thapsigargin compared with control (20 mm glucose) are plotted ± sem and analyzed via Student's t test, unpaired and two tailed; **, P < 0.01. Results are from three separate experiments (five to 15 cells per experiment). Panel E, MIN6 cells were mock-infected or infected with Ad-Empty (AdE) or Ad-PERKΔC for 48 h. After infection, the cells were preincubated in KRB in the presence of 20 mm glucose for 1 h. Cells were then treated for an additional 1 h in KRB in the presence or absence of 1 μm thapsigargin (Tg). Proteins were resolved on SDS-PAGE and Western blotted using antisera against phospho-PERK (P-PERK) (Thr980), phospho-eIF2α (P-eIF2α) (Ser51), and total eIF2α as a loading control. Quantified Western blots of phospho-eIF2α are shown as means ± sem; n = 3.***, P < 0.001. P value was obtained using a one-way ANOVA compared with control (Mock). AU, Arbitrary units; C, control.
Fig. 3.
Fig. 3.
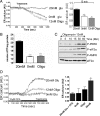
The ER to cytosolic calcium concentration gradient does not influence ER calcium store depletion in glucose-deprived cells. A and B, [Ca2+]i was measured using fura-2-AM. MIN6 cells were exposed to 20 mm glucose and then 0 mm glucose (A) or 0 mm glucose plus depolarizing concentrations of potassium (K+50) (B). Representative traces are shown. Results are from three separate experiments (20–30 cells per experiment). C, [Ca2+]ER was measured using the D1ER cameleon probe in response to depolarizing concentrations of potassium (K+50). Quantitative comparison was made of the [Ca2+]ER levels induced by 0 mm glucose with or without K+50. Results are from three separate experiments (five to 15 cells per experiment) shown as mean ± sem; n = 3. Statistical analysis was performed using a one-way ANOVA followed by Bonferroni posttests between 0 mm and K+50. AU, Arbitrary units.
Fig. 4.
Fig. 4.
A decrease in the energy status of the cell results in the depletion of ER calcium stores via inhibition of the SERCA pump. A, [Ca2+]ER was measured in intact MIN6 cells using the D1ER cameleon probe. Cells were treated with KRB containing 20 mm glucose (glu) before being treated with KRB supplemented with 20 mm glucose in the presence of 12 nm oligomycin (Oligo) or KRB minus glucose. Quantitative comparison of the [Ca2+]ER levels compared with control (20 mm glucose). Results are from three separate experiments (five to 15 cells per experiment) shown as mean ± sem; n = 3. **, P < 0.01. P value was obtained using a one-way ANOVA followed by Bonferroni posttests compared with control (20 mm glucose). B, MIN6 cells were incubated with KRB containing 20 mm glucose before being treated with 12 nm oligomycin or incubated with KRB minus glucose for 15 min. ATP content is expressed as nanomoles of ATP per milligram of total protein shown as mean ± sem; n = 3. ***, P < 0.005. P value was obtained using a one-way ANOVA followed by Bonferroni posttests compared with control (20 mm glucose). C, MIN6 cells were preincubated in KRB containing 20 mm glucose for 1 h. Cells were then treated with KRB supplemented with 20 mm glucose in the presence of 12 nm oligomycin for the times indicated. Proteins were resolved on SDS-PAGE and Western blotted using antisera against phospho-PERK (P-PERK) (Thr980), phospho-eIF2α (P-eIF2α) (Ser51), phospho-AMPK (P-AMPK) (Thr172), and total eIF2α as a loading control. Results are representative of three separate experiments. D, To monitor the rate of [Ca2+]ER refilling, the ER store was depleted of Ca2+ by incubating cells in KRB containing 20 mm glucose and 10 μm CPA for 15 min. Cells were then perfused with KRB containing 12 nm oligomycin in the presence of 20 mm glucose or as controls KRB or KRB 20 mm glucose. Quantitative comparison was made of the [Ca2+]ER levels. Results are from three separate experiments (five to 15 cells per experiment) shown as mean ± sem; n = 3. *, P < 0.05. P value was obtained using a one-way ANOVA followed by Bonferroni posttests compared with control (20 mm glucose plus CPA).
Fig. 5.
Fig. 5.
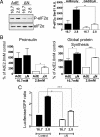
Functional consequences of PERK activation on protein synthesis in rat islets of Langerhans. A, Dispersed islets were infected with control Ad-Empty virus (AdE) or AdGADDΔN (ΔN) for 48 h. After infection, the cells were incubated for 2 h in KRB at 2.8 or 16.7 mm glucose in the presence of 35S-labeled methionine/cysteine. Proteins were resolved on SDS-PAGE and Western blotted using antisera against phospho-eIF2α (P-eIF2α) (Ser51) or total eIF2α as a loading control. Quantified Western blots of phospho-eIF2α are shown as mean ± sem; n = 3. **, P < 0.01. P value was obtained using a one-way ANOVA followed by Bonferroni posttests. B, Densitometry values from autoradiographs of 35S-labeled methionine/cysteine incorporation into proinsulin and total protein are plotted ± sem and analyzed by Student's t test, unpaired and two tailed; *, P < 0.05; **, P < 0.01; ***, P < 0.005 (n = 3) expressed as a percentage of 2.8 mm (Ad-Empty). C, Dispersed islets were infected with Ad-ATF4luc in the presence or absence of Ad-GADDΔN for 24 h. After infection, the cells were incubated for 2 h in KRB at 2.8 or 16.7 mm glucose in the presence of 35S-labeled methionine/cysteine. Cells were then lysed, and luciferase and GFP were immunoprecipitated. Immunoprecipitants were run out on SDS-PAGE gels, and the incorporation of [35S]methionine/cysteine into luciferase and GFP were detected by autoradiography and expressed as luciferase/GFP ratio.
Fig. 6.
Fig. 6.
PERK-dependent eIF2α phosphorylation plays an important role in maintaining β-cell viability and confers preemptive cytoprotection against ER stress. INS-1E cells were infected with control Ad-Empty (AdE) or AdGADDΔN (ΔN) viruses and incubated in full DMEM minus glucose medium supplemented with 2.8, 5.5, or 16.7 mm glucose for 48 h. Panels A and B, Cells were then lysed and proteins resolved on SDS-PAGE and Western blotted using antisera against phospho-eIF2α (P-eIF2α) (Ser51) or total eIF2α as a loading control (A) fixed and propidium iodide stained for analysis by flow cytometry (B). The percentage of dead cells was determined by the percentage of cells within the sub G1/0 population. Results were analyzed by an unpaired and two-tailed Student's t test; *, P < 0.05 (n = 4). Panels C and D, Survival of INS-1E cells pretreated for 4 h with either 10 μm CPA (C) or 0 mm glucose (D) followed by 24 h of recovery and subsequent challenge with 1 μm thapsigargin (Tg) for 8 h. Panel E, INS-1E cells were treated for 4 h with either 10 μm CPA or incubated in RPMI minus glucose followed by 24 h of recovery (24 h Rec) or not (0 h Rec). Cells were loaded with 2 μm Fluo4 in KRB minus calcium before injection of 10 μm ionomycin. Changes in fluorescence were read immediately in a Novostar (BMG Labtech) 96-well plate reader. Peak increases in calcium upon ionomycin treatment were measured and plotted as percentage of control. Panel F, Cytoplasmic and nuclear extracts were collected from untreated INS-1E cells or cells incubated with 0 mm glucose for 1 and 4 h, 24 h after recovery (R) and after 8 h exposure to thapsigargin. Proteins were resolved on SDS-PAGE and Western blotted using antisera against phospho-eIF2α (Ser51), ATF-4, CHOP, and total eIF2α as a loading control. Panel G, INS-1E cells were infected with a control Ad-Empty virus or infected with AdGADDΔN for 36 h. After infection, the cells were incubated in the absence of glucose for 4 h followed by 24 h recovery and subsequent challenge with 1 μm thapsigargin for 8 h. In panels C, D, and G, cells were subjected to a luminometric caspase 3/7 activation assay as described in Materials and Methods. Data are expressed as relative light units (RLU). Results are expressed as mean ± sem. *, P < 0.05; **, P < 0.01; ***, P < 0.005 (n = 6). P value was obtained using a one-way ANOVA followed by Bonferroni posttests compared with control (C).

References

    1. Gomez E, Powell ML, Greenman IC, Herbert TP. 2004. Glucose-stimulated protein synthesis in pancreatic β-cells parallels an increase in the availability of the translational ternary complex (eIF2-GTP. Met-tRNAi) and the dephosphorylation of eIF2α. J Biol Chem 279:53937–53946 - PubMed
    1. Guest PC, Rhodes CJ, Hutton JC. 1989. Regulation of the biosynthesis of insulin-secretory-granule proteins. Co-ordinate translational control is exerted on some, but not all, granule matrix constituents. Biochem J 257:431–437 - PMC - PubMed
    1. Itoh N, Okamoto H. 1980. Translational control of proinsulin synthesis by glucose. Nature 283:100–102 - PubMed
    1. Itoh N, Sei T, Nose K, Okamoto H. 1978. Glucose stimulation of the proinsulin synthesis in isolated pancreatic islets without increasing amount of proinsulin mRNA. FEBS Lett 93:343–347 - PubMed
    1. Permutt MA. 1974. Effect of glucose on initiation and elongation rates in isolated rat pancreatic islets. J Biol Chem 249:2738–2742 - PubMed

Publication types

MeSH terms