

Review
doi: 10.2337/db10-0909.
Toward a more complete (and less controversial) understanding of energy expenditure and its role in obesity pathogenesis
Affiliations
- PMID: 21193735
- PMCID: PMC3012169
- DOI: 10.2337/db10-0909
Item in Clipboard
Review
Toward a more complete (and less controversial) understanding of energy expenditure and its role in obesity pathogenesis
Diabetes.
2011 Jan.
No abstract available
Figures
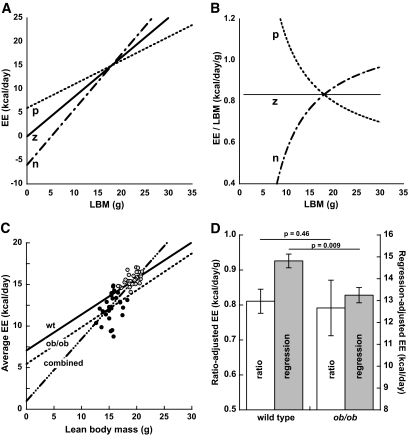
Illustration of the confounding effect of traditional ratio-based EE normalization contrasted with multiple regression analysis to control for LBM disparity. A and B: Nonzero y-intercept values confound normalization using EE/LBM. Linear regression prediction lines for mean EE values as a function of LBM can potentially have a positive (p), zero (z), or negative (n) y-intercept depending on the data (A). Fits of average daily or resting EE typically entail a positive y-intercept, whereas measures of peak or maximal EE typically entail a negative y-intercept. If the y-intercept is positive, ratios formed by dividing EE by LBM are confounded since they produce normalized EE values that decrease as LBM increases, whereas if the parent relationship has a negative y-intercept, LBM ratio-normalized EE increase as LBM increases (B). Zero-value y-intercepts arguably justify the use of ratio normalization but such relationships are uncommon, and even small departures from zero can significantly confound group comparisons (28). C and D: Comparison of ratio- vs. regression-based analysis of average daily EE controlling for LBM disparity in lean male WT C57BL/6J (circles with dots; aged 8–12 weeks; n = 32) and genetically obese ob/ob mutant mice (filled circles; aged 10–13 weeks; n = 28). EE (indirect calorimetry) was regressed on LBM (quantitative magnetic resonance) using the combined data from both genotypes (C; labeled “combined”). Although the resultant, small positive y-intercept suggests that traditional ratio normalization might be appropriate for analysis of group differences, this analysis indicates no significant EE phenotype difference between groups, whereas analysis by multiple regression discloses a significant reduction of EE in the ob/ob mice after controlling for differences in body composition (D). The offset of the two regression lines (i.e., the difference between their y-intercepts) in C corresponds to the adjusted group difference in EE. For additional analysis details see supplementary materials.
Similar articles
-
Pathogenesis of obesity and diabetes mellitus: insights provided by indirect calorimetry in humans.Acta Diabetol. 2001;38(1):7-21. doi: 10.1007/s005920170023. Acta Diabetol. 2001. PMID: 11487178 Review.
-
An obligate role of oxytocin neurons in diet induced energy expenditure.PLoS One. 2012;7(9):e45167. doi: 10.1371/journal.pone.0045167. Epub 2012 Sep 18. PLoS One. 2012. PMID: 23028821 Free PMC article.
-
Tbc1d1 deletion suppresses obesity in leptin-deficient mice.Int J Obes (Lond). 2016 Aug;40(8):1242-9. doi: 10.1038/ijo.2016.45. Epub 2016 Mar 22. Int J Obes (Lond). 2016. PMID: 27089993
-
Acutely reduced locomotor activity is a major contributor to Western diet-induced obesity in mice.Am J Physiol Endocrinol Metab. 2008 Feb;294(2):E251-60. doi: 10.1152/ajpendo.00401.2007. Epub 2007 Nov 20. Am J Physiol Endocrinol Metab. 2008. PMID: 18029443
-
Energy balance, food and exercise.World Rev Nutr Diet. 2001;90:13-25. doi: 10.1159/000059805. World Rev Nutr Diet. 2001. PMID: 11545039 Review. No abstract available.
Cited by
-
Early postnatal nutrition determines adult physical activity and energy expenditure in female mice.Diabetes. 2013 Aug;62(8):2773-83. doi: 10.2337/db12-1306. Epub 2013 Apr 1. Diabetes. 2013. PMID: 23545705 Free PMC article.
-
The effects of short-term overfeeding on energy expenditure and nutrient oxidation in obesity-prone and obesity-resistant individuals.Int J Obes (Lond). 2013 Sep;37(9):1192-7. doi: 10.1038/ijo.2012.202. Epub 2012 Dec 11. Int J Obes (Lond). 2013. PMID: 23229737 Free PMC article.
-
Anorexia and impaired glucose metabolism in mice with hypothalamic ablation of Glut4 neurons.Diabetes. 2015 Feb;64(2):405-17. doi: 10.2337/db14-0752. Epub 2014 Sep 3. Diabetes. 2015. PMID: 25187366 Free PMC article.
-
Influence of intestinal microbiota on body weight gain: a narrative review of the literature.Obes Surg. 2015 Feb;25(2):346-53. doi: 10.1007/s11695-014-1525-2. Obes Surg. 2015. PMID: 25511750 Review.
-
Grape Polyphenols Attenuate Diet-Induced Obesity and Hepatic Steatosis in Mice in Association With Reduced Butyrate and Increased Markers of Intestinal Carbohydrate Oxidation.Front Nutr. 2021 Jun 14;8:675267. doi: 10.3389/fnut.2021.675267. eCollection 2021. Front Nutr. 2021. PMID: 34195217 Free PMC article.
References
-
- Farooqi IS, O'Rahilly S: Monogenic human obesity syndromes. Recent Prog Horm Res 2004;59:409–424 - PubMed
Publication types
MeSH terms
Grants and funding
- U24 DK076126/DK/NIDDK NIH HHS/United States
- DK017047/DK/NIDDK NIH HHS/United States
- R01 DK052989/DK/NIDDK NIH HHS/United States
- R01 DK083042/DK/NIDDK NIH HHS/United States
- P01 DK068384/DK/NIDDK NIH HHS/United States
- P30 DK035816/DK/NIDDK NIH HHS/United States
- DK083042/DK/NIDDK NIH HHS/United States
- DK068384/DK/NIDDK NIH HHS/United States
- DK035816/DK/NIDDK NIH HHS/United States
- P30 DK017047/DK/NIDDK NIH HHS/United States
- R01 DK090320/DK/NIDDK NIH HHS/United States
- U24 DK076169/DK/NIDDK NIH HHS/United States
- DK052989/DK/NIDDK NIH HHS/United States
- U24DK076169/DK/NIDDK NIH HHS/United States
LinkOut - more resources
Full Text Sources
Other Literature Sources
Medical
