. 2011 Feb 18;108(4):446-57.
doi: 10.1161/CIRCRESAHA.110.236596. Epub 2010 Dec 30.

Activation of vascular bone morphogenetic protein signaling in diabetes mellitus

Affiliations

Activation of vascular bone morphogenetic protein signaling in diabetes mellitus

Kristina I Boström et al. Circ Res. .

Abstract

Rationale: Diabetes mellitus is frequently complicated by cardiovascular disease, such as vascular calcification and endothelial dysfunction, which have been associated with bone morphogenetic proteins (BMPs).

Objective: To determine whether hyperglycemia in vitro and diabetes in vivo promote vascular BMP activity and correlate with vascular calcification.

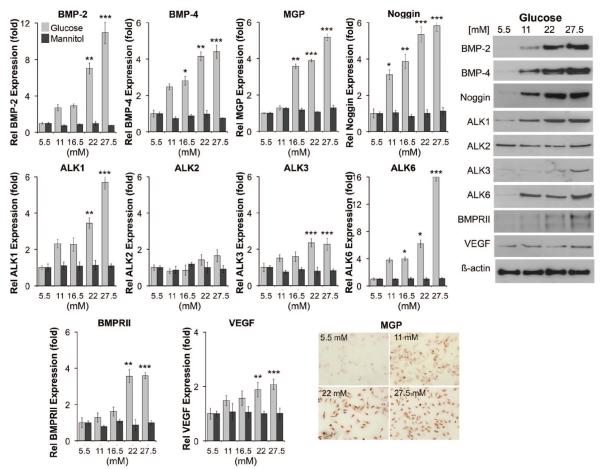
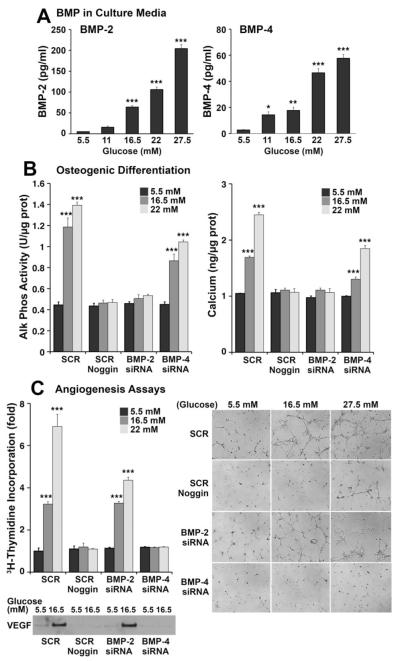
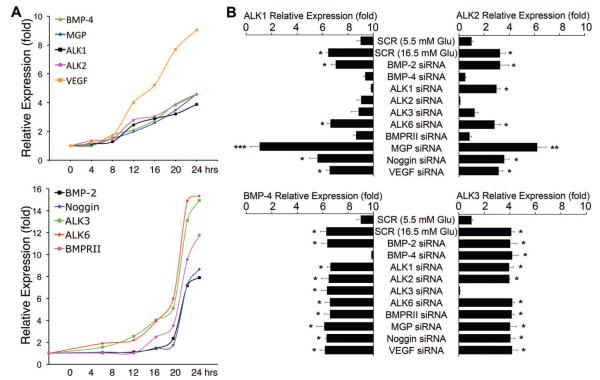
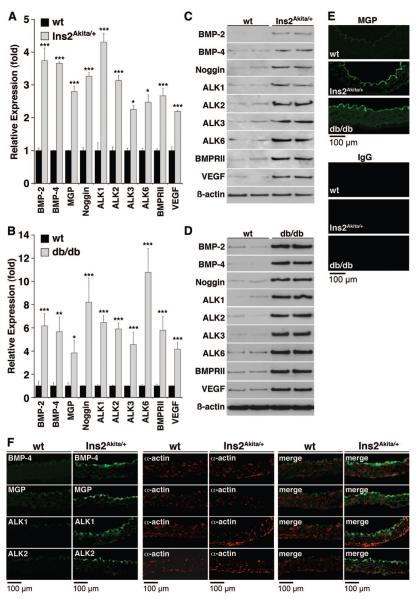
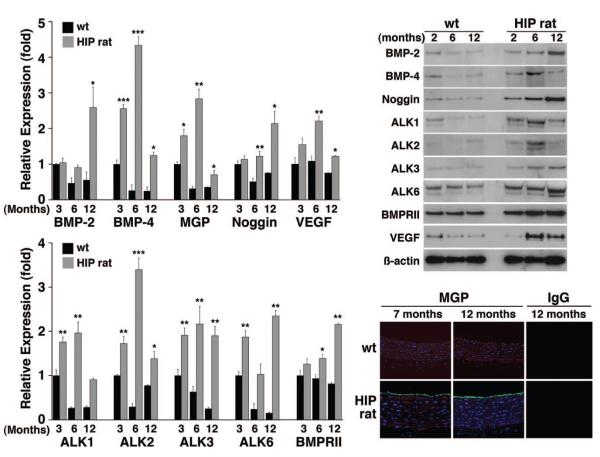
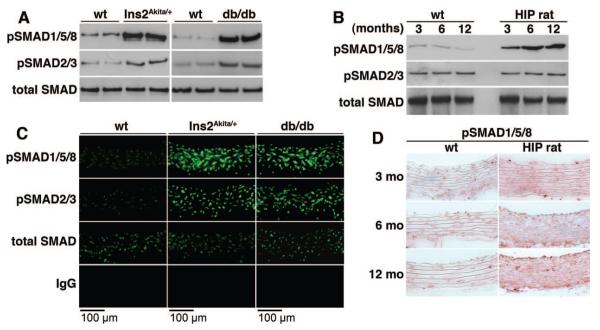
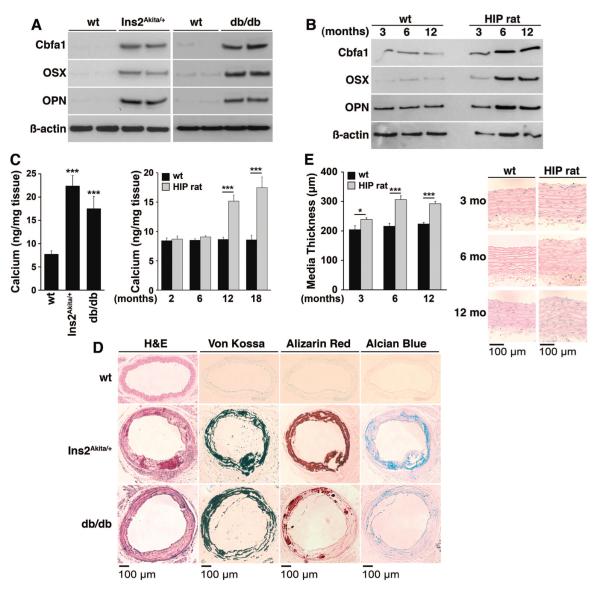
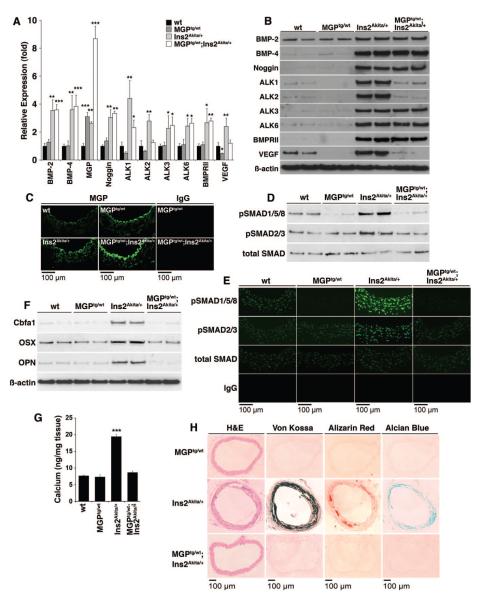
Methods and results: Increased glucose augmented expression of BMP-2 and BMP-4; the BMP inhibitors matrix Gla protein (MGP) and Noggin; activin-like kinase receptor (ALK)1, -2, -3 and -6; the BMP type 2 receptor; and the vascular endothelial growth factor in human aortic endothelial cells (HAECs). Diabetes induced expression of the same factors in the aortic wall of 3 animal models of diabetes, Ins2(Akita/+) mice, db/db mice, and HIP rats (rats transgenic for human islet amyloid polypeptide), representative of types 1 and 2 diabetes. Conditioned media from glucose-treated HAECs increased angiogenesis in bovine aortic endothelial cells, as mediated by BMP-4, and osteogenesis in calcifying vascular cells, as mediated by BMP-2. BMP-4, MGP, ALK1, and ALK2 were predominantly expressed on the endothelial side of the aorta, and small interfering RNA experiments showed that these genes were regulated as a group. Diabetic mice and rats showed a dramatic increase in aortic BMP activity, as demonstrated by SMAD1/5/8 phosphorylation. This was associated with increased osteogenesis and calcium accumulation. These changes were prevented in the Ins2(Akita/+) mice by breeding them with MGP transgenic mice, which increased aortic BMP inhibition.

Conclusions: Hyperglycemia and diabetes activate vascular BMP activity, which is instrumental in promoting vascular calcification and may be limited by increasing BMP inhibition.


Figures

Figure 1
Figure 1. Expression of BMP components in HAECs in response to increasing concentrations of glucose
HAECs were treated with increasing concentrations of glucose (5.5 to 27.5 mmol/L) or control D-mannitol for 24 hours. Expression of the indicated genes was determined by real-time PCR (left) and immunoblotting or immunohistochemistry (for MGP) (right). Asterisks indicate statistically significant differences compared with 5.5 mmol/L glucose: *P<0.05, **P<0.01, ***P<0.001 (Tukey test).
Figure 2
Figure 2. Increased BMP activity in conditioned media from glucose-treated HAECs
A, Levels of BMP-2 (left) and BMP-4 (right) in conditioned media from HAECs treated with glucose (5.5 to 27.5 mmol/L) for 24 hours, as determined by ELISA. B, Alkaline phosphate activity (left) and calcium accumulation (right) in CVCs incubated with conditioned media from HAECs treated with glucose (5.5 to 27.5 mmol/L) were determined after 2 and 8 days, respectively. Before glucose treatment, HAECs were transfected with siRNA for BMP-2 or BMP-4 to selectively deplete these in the conditioned media. Scrambled siRNA (SCR) was used as control. Noggin was added to inhibit the activity of both BMP-2 and BMP-4. C, Cell proliferation (left) and tube formation (right) in BAECs incubated with the same conditioned media from siRNA-transfected and glucose-treated HAECs as above. VEGF in the conditioned media was examined by immunoblotting. Asterisks indicate statistically significant differences compared with control 5.5 mmol/L glucose: *P<0.05, **P<0.01, ***P<0.001 (Tukey test).
Figure 3
Figure 3. Coordinated regulation of expression of BMP-4, ALK2, ALK1, MGP, and VEGF in glucose-treated HAECs
A, HAECs were treated with glucose (16.5 mmol/L) for up to 24 hours. Samples were taken every 4 hours and expression of the indicated genes was determined by real-time PCR. B, HAECs were transfected with scrambled (SCR) or specific siRNA as indicated in the figure and treated with glucose (5.5 or 16.5 mmol/L) for 24 hours starting 24 hours after transfection. Expression of ALK1, ALK2, BMP-4, and ALK3 was determined by real-time PCR. Asterisks indicate statistically significant differences compared with SCR control (5.5 mmol/L glucose): *P<0.05, **P<0.01, ***P<0.001 (Tukey test).
Figure 4
Figure 4. Aortic expression of BMP components in Ins2Akita/+ and db/db mice
Aortas were obtained from Ins2Akita/+ and db/db mice aged 20 weeks. A and B, Expression of the indicated genes was determined by real-time PCR and compared with wild-type (n=4 animals in each group). C through E, Protein levels were determined by immunoblotting or immunofluorescence (for MGP). F, Aortas were obtained from Ins2Akita/+ mice aged 20 weeks and used for immunofluorescence. BMP-4, MGP, ALK1, and ALK2 (green) were detected on the luminal side (up) by the endothelium and did not colocalize with smooth muscle α-actin (red). Asterisks indicate statistically significant differences compared with wild type: *P<0.05, **P<0.01, ***P<0.001 (Tukey test).
Figure 5
Figure 5. Aortic expression of BMP components in HIP rats
Aortas were obtained from HIP rats aged 3 to 12 months. Left, Expression of the indicated genes was determined by real-time PCR and compared with wild type rats (n=6 animals in each group). Right, Protein levels were determined by immunoblotting or immunofluorescence (for MGP). Asterisks indicate statistically significant differences; each group was compared with wild type at 3 months of age: *P<0.05, **P<0.01, ***P<0.001 (Tukey test).
Figure 6
Figure 6. Increased vascular BMP signaling in diabetic mice and rats
A through D, Aortic BMP activity in Ins2Akita/+ and db/db mice aged 20 weeks (A and C) and HIP rats aged 3 to 12 months (B and D), as determined by immunoblotting for pSMAD1/5/8 (A and B), immunofluorescence (C), and immunohistochemistry (D) and compared with wild-type animals. PSMAD1/5/8 was compared with pSMAD2/3, which show TGF-β activation, and total SMAD.
Figure 7
Figure 7. Increased osteogenic differentiation in the aortas of diabetic mice and rats
A and B, Aortic expression of osteogenic markers in Ins2Akita/+ and db/db mice aged 20 weeks (A) and HIP rats aged 3 to 12 months (B), as determined by immunoblotting. C, Total calcium accumulation Ins2Akita/+ and db/db mice aged 20 weeks and HIP rats aged 3 to 18 months. D, Calcium and cartilage-associated mucopolysaccharides in Ins2Akita/+ and db/db mice aged 20 weeks, as determined by histochemical staining. E, Media thickness in HIP rats aged 3 to 12 months (n=6 animals in each group). Asterisks indicate statistically significant differences compared with wild type: *P<0.05, ***P<0.001 (Tukey test).
Figure 8
Figure 8. Enhanced BMP inhibition limits diabetic vascular disease in Ins2Akita/+ mice
A through C, Aortic expression of BMP components in wild-type, MGPtg/wt, Ins2Akita/+, and MGPtg/wt; Ins2Aktiat/+ mice aged 20 weeks, as determined by real-time PCR (n=3 mice in each group) (A), immunoblotting (B), and immunofluorescence (for MGP) (C). Asterisks indicate statistically significant differences in MGPtg/wt and MGPtg/wt; Ins2Aktiat/+ mice compared with wild-type and Ins2Akita/+ mice, respectively: *P<0.05, ***P<0.001 (Tukey test). D, Aortic BMP activity in wild-type, MGPtg/wt, Ins2Akita/+, and MGPtg/wt;Ins2Aktiat/+ mice, as determined by immunoblotting for pSMAD1/5/8. E, Aortic BMP activity in wild-type, MGPtg/wt, Ins2Akita/+, and MGPtg/wt;Ins2Aktiat/+ mice aged 20 weeks, as determined by immunofluorescence for pSMAD1/5/8, and compared with pSMAD2/3 and total SMAD. F, Aortic expression of osteogenic markers in wild-type, MGPtg/wt, Ins2Akita/+, and MGPtg/wt; Ins2Aktiat/+ mice, as determined by immunoblotting. G, Total calcium accumulation in wild-type, MGPtg/wt, Ins2Akita/+, and MGPtg/wt;Ins2Aktiat/+ mice (n=3 mice in each group). Asterisks indicate a statistically significant difference between the MGPtg/wt;Ins2Aktiat/+ mice and the Ins2Akita/+mice. ***P<0.001 (Tukey test). H, Calcium mineral and cartilage-associated mucopolysaccharides in MGPtg/wt, Ins2Akita/+, and MGPtg/wt; Ins2Aktiat/+ mice, as determined by histochemical staining.

References

    1. Amos AF, McCarty DJ, Zimmet P. The rising global burden of diabetes and its complications: estimates and projections to the year 2010. Diabet Med. 1997;14(Suppl 5):S1–85. - PubMed
    1. Luscher TF, Creager MA, Beckman JA, Cosentino F. Diabetes and vascular disease: pathophysiology, clinical consequences, and medical therapy: Part II. Circulation. 2003;108:1655–1661. - PubMed
    1. Wu KK, Huan Y. Diabetic atherosclerosis mouse models. Atherosclerosis. 2007;191:241–249. - PubMed
    1. Vattikuti R, Towler DA. Osteogenic regulation of vascular calcification: an early perspective. Am J Physiol Endocrinol Metab. 2004;286:E686–E696. - PubMed
    1. Sage AP, Tintut Y, Demer LL. Regulatory mechanisms in vascular calcification. Nat Rev Cardiol. 2010;7:528–536. - PMC - PubMed

Publication types

MeSH terms