Review
. 2011 Apr;27(4):523-64.
doi: 10.1007/s00381-010-1358-9. Epub 2010 Dec 31.

Embryology and bony malformations of the craniovertebral junction

Affiliations
Review

Embryology and bony malformations of the craniovertebral junction

Dachling Pang et al. Childs Nerv Syst. 2011 Apr.

Abstract

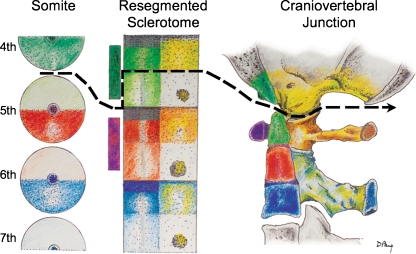
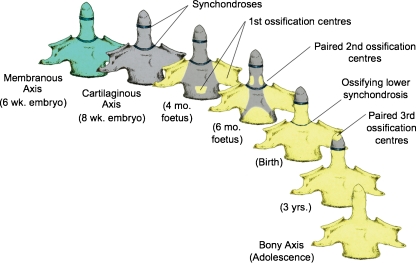
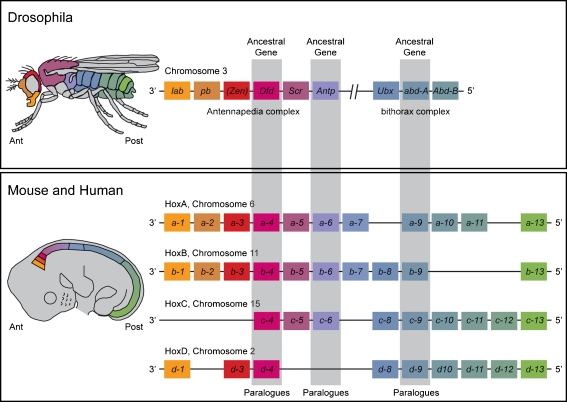
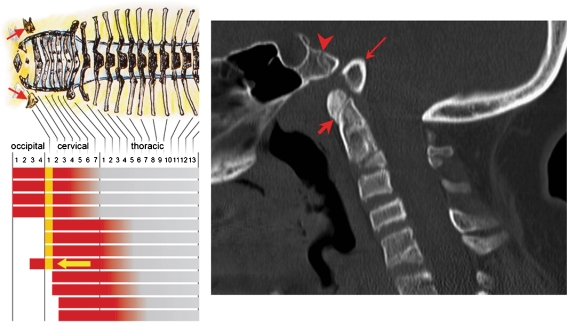
Background: The embryology of the bony craniovertebral junction (CVJ) is reviewed with the purpose of explaining the genesis and unusual configurations of the numerous congenital malformations in this region. Functionally, the bony CVJ can be divided into a central pillar consisting of the basiocciput and dental pivot and a two-tiered ring revolving round the central pivot, comprising the foramen magnum rim and occipital condyles above and the atlantal ring below. Embryologically, the central pillar and the surrounding rings descend from different primordia, and accordingly, developmental anomalies at the CVJ can also be segregated into those affecting the central pillar and those affecting the surrounding rings, respectively.

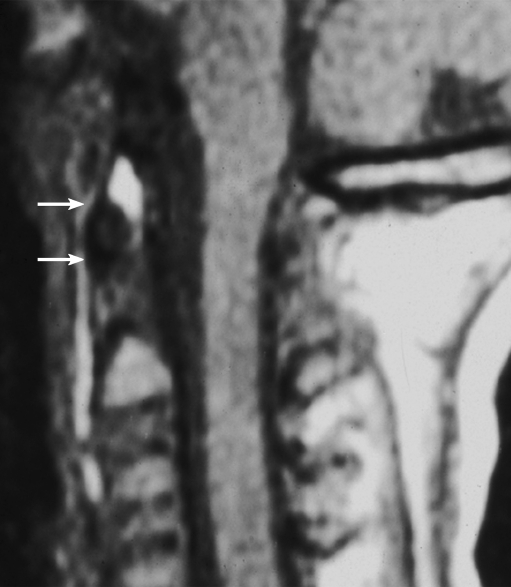
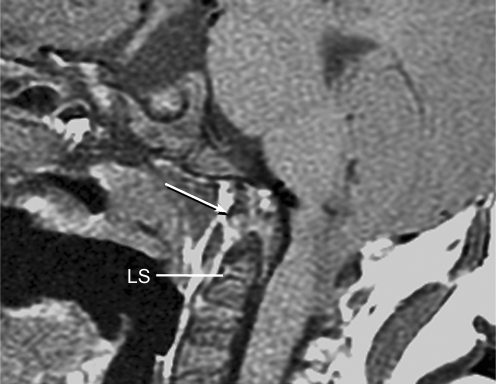
Discussion: A logical classification of this seemingly unwieldy group of malformations is thus possible based on their ontogenetic lineage, morbid anatomy, and clinical relevance. Representative examples of the main constituents of this classification scheme are given, and their surgical treatments are selectively discussed.


Figures

Fig. 1
Fig. 1
Vertebrate embryonic plate around gastrulation showing the three main regions of the body plan: The prechordal mesoderm (PM) is anterior to the otic vesicle (OV). Posterior to the OV to the blastopore (B) is the somitic region of the trunk (ST), caudal to which is the caudal (tail) somitic region (SC)
Fig. 2
Fig. 2
Somite with radially arranged and polarized epithelial cells surrounding a central cavity, the somitocoele (SC) and enveloped by a basal lamina (BL)
Fig. 3
Fig. 3
Primary somitogenesis in a chick embryo. A At very early gastrulation, the mostly unneurulated neural plate caudal to the prochordal plate (head process) is flanked on each side by the presomitic (presegmented) mesoderm, or PSM. B The first pair of somites are formed just caudal to the otic vesicles. The PSM column elongates from addition of new cells from the caudal embryonic pole rostral to Hensen’s node. C The new somites (SN) are formed in a rostrocaudal direction so that the older more matured somites (SM) are rostral, i.e. closer to the cephalic end of the embryo. D The older matured somites (SM) have undergone dorsoventral differentiation (purple colour) into sclerotome and dermomyotome. The intermediate-aged somites (SI) (orange colour) are pre-differentiated units without dorsoventral specification. The PSM is always at the most caudal end closest to Hensen’s node. Rostrocaudal sequential somitogenesis parallels progression of primary neurulation. HN Hensen’s node, PS primitive streak, T telencephalon, R rhombencephalon, NT neural tube, NP neural plate
Fig. 4
Fig. 4
Chick embryo during sequential somite formation close to the end of gastrulation. The rostral most mesoderm consists of matured somites (SM) already having undergone dorsoventral differentiation into dermomyotome and sclerotome, flanking the formed neural tubes (NT); followed by the newer intermediate-aged pre-differentiated epithelial somites (SI), the new somites (SN) and the presomitic mesoderm (PSM) on each side of the unneurulated neural plate (NP). HN Hensen’s node, PS primitive streak, T telencephalon, R rhombencephalon
Fig. 5
Fig. 5
The clock and wavefront theory of primary somitogenesis. The segmentation clock is a pattern of cell autonomous, phase-linked oscillations of certain “cycling” genes expression within the PSM cells, producing a sinusoidal wave of peaks and troughs of gene products which render the cell either “permissive” or “non-permissive” to changes when “hit” by a moving wavefront. Block arrow shows direction of wavefront. When the wavefront (curved lines) hits the “permissive” peak of the gene cycle, the cells at that region of the PSM undergo changes which demarcate them from the surrounding uncommitted mesenchyme, causing formation of a boundary zone (dotted vertical lines) cutting across the whole width of the PSM column because the clock periods (time lapses between wave peaks) in the PSM are in synchrony. The distance between two boundary lines thus represents the height of a somite, which, in turn, depends on the clock period and, to a certain extent, the velocity of the moving wavefront. Thus, in the clock and wavefront model of primary somitogenesis, time, in terms of the clock period, is transformed into space, in terms of the somite size. The clock periodicity is species specific
Fig. 6
Fig. 6
Periodic boundary formation across the width of the PSM column along its rostrocaudal axis causes segregated somites to form sequentially. The distance between two adjacent boundaries represents the longitudinal dimension of a somite
Fig. 7
Fig. 7
The molecular basis of the segmentation clock. A ligand (e.g. Delta) is bound to the surface Notch signalling receptor, whose intracellular domain (NICD) then detaches from the cell membrane and enters the nucleus, where it co-activates cycling genes of the C-hairy 1 family, encoding transcription factors such as HES, HER, HAIRY and Lunatic Fringe. In chick, Lunatic Fringe is known to recycle back to the cell surface, where it “enables” the surface Notch signalling receptor to accept another ligand. The repetitive working of this simplified cycling gene model is the underlying mechanism of the oscillating segmentation clock
Fig. 8
Fig. 8
AE The molecular basis of the somitogenesis wavefront. Boundary formation at the PSM is linked to expressions of fibroblast growth factor genes, especially fgf8. High concentrations of FGF8 maintains PSM cells in a primitive mesenchymal state, but a low concentration of FGF8 permits PSM cells to form boundary during the segmentation clock peak. Thus, the epithelial transformation (into somites) of PSM cells is negatively regulated by fgf8. High concentration of FGF8 is expressed by newly formed PSM cells at Hensen’s node, and low concentration is expressed in “older” PSM cells near the somitogenesis front. Thus, the limit between the high and low fgf8 domains near the site of active somitogenesis represents the somitogenesis wavefront (represented by the apex of the FGF8 triangle). Because new PSM cells are continually being formed near Hensen nodes and the PSM column constantly elongates and gets ever “older” near the last formed somite, the wavefront also moves caudally. High concentration of FGF8 is indicated by deep red colour and low concentration by pale grey to white. The moving FGF8 gradient is also displayed by the coloured triangle. HN Hensen’s node, PS primitive streak, PSM presomitic mesoderm, SN new somite, SM mature somite. Significance of somite colours as in Fig. 3
Fig. 9
Fig. 9
Dorsoventral differentiation of somite. A Epithelial somite shows ventromedial cells (VM) destined to form the sclerotome. B Ventromedial sclerotome cells (Scl) de-epithelize from the somite and migrate towards the ventral notochord (NC). C Sclerotomal cells further subdivide into an axial cluster (Scl-A) surrounding the notochord, and lateral paired clusters (Scl-L) flanking the perichordal axial sclerotome. Dorsolateral somite retains its epithelial pattern to become the dermomyotome (DM). D The lateral sclerotome (Scl-L) forms a triangle next to the axial sclerotome. The three sides of the triangle become anlagen for the pedicle (P), neural arch (N) and the costal process (C), respectively. The dermomyotome also subdivides into the dermatome (D) and the lateral migrating myotome (M)
Fig. 10
Fig. 10
A transplanted notochord (TNC) to the dorsal aspect of the somite induces sclerotomal differentiation dorsally and represses dermomyotomal formation on the side of the transplant, indicating inducers from the notochord directs dorsoventral specification of the somite. DM dermomyotome, Scl-A axial sclerotome, Scl-L lateral sclerotome
Fig. 11
Fig. 11
Expressions of sonic hedgehog gene (shh) (blue arrows) from the notochord and floor plate of the neural tube signal sclerotomal differentiation and ventral migration from the somite. Bone morphogenetic protein (BMP) (yellow arrow) expressed by the roof plate and Wnt signalling (green arrow) from the ectoderm (grey mantle) induce dermomyotome differentiation. Other lateralizing signals (red arrow) further encourage myotomal cell development
Fig. 12
Fig. 12
Coronal section of chick embryo after dorsoventral differentiation of somites, showing axial or perichordal sclerotome (Scl-A) surrounding the notochord (NC), and lateral sclerotome (Scl-L) on both sides of the neural tube (NT). D dermatome, M myotome, YS yolk sac membrane
Fig. 13
Fig. 13
Resegmentation of somites to form sclerotomes and changes of sclerotomal primordia to mature vertebral parts. The somitic and primordial origins of vertebral parts and phenotypic parts are colour-matched, and the locations of the somites, resegmented sclerotomes, and vertebrae along the embryonic axis are approximately counter-registered. During resegmentation, the sclerotome is formed from the caudal and rostral halves of two adjacent somites, such that the middle of the resegmented sclerotome lines up with the intersomitic cleft (IC). Both the axial sclerotome (Scl-A) and lateral sclerotome (Scl-L) develop dense and loose zones. The dense zone of the lateral sclerotome (Ld) becomes the neural arch (NA) and pedicle (P), which is attached to the rostral part of the vertebral body (VB) formed from chondrification of the loose (Al) and part of the dense zones (Ad) of the axial sclerotome. The rostral layer of the dense zone of the axial sclerotome soon forms the intervertebral boundary zone (IBZ) containing intervertebral boundary mesenchyme (IBM), which ultimately forms the annulus (A) and, together with notochord remnants (NC), the nucleus pulposus (NP) of the intervertebral disc (ID). The loose zone of the lateral sclerotome (Ll) does not form bone but promotes emergence of the nerve roots (NR). Thus, the neural arch is derived from a single somite but the vertebral body receives contributions from two adjacent somites. IV intersomitic vessel. Arrows indicate developmental fates of the sclerotomes
Fig. 14
Fig. 14
Formation of the human craniovertebral junction. Sclerotomal primordia and their vertebral phenotypes are colour-matched. During resegmentation, the caudal half of the fourth somite (fourth occipital somite) and rostral half of the fifth somite combine to form the proatlas sclerotome (PA). Derived from the proatlas are: the axial zones (Ad and Al) which become the basion (B) of the basioccipital or clivus (CL) and the apical segment of the dens (AD); the lateral dense zone (Ld) becomes the exoccipital comprising the occipital condyle (OC), and lateral rim and opisthion (OT) of the foramen magnum; the proatlas’ hypochordal bow (HB p) forms the ventral clival tubercle (CT). The C1 resegmented sclerotome (C 1) comes from adjacent halves of the fifth and sixth somites. Derived from the C1 sclerotome are: the axial zones form the basal segment of the dens (BD); the lateral zone forms the posterior atlantal arch (C 1 P); the hypochordal bow (HB c) forms the anterior atlantal arch (C 1 A). The C2 resegmented sclerotome (C 2) comes from the sixth and seventh somites. From the C2 sclerotome: the axial zone forms the C2 vertebral body (AB); the lateral zone forms the neural arch of C2 vertebra. The intervertebral boundary zone (IBZ) between the proatlas and C1 sclerotome forms the upper dental synchondrosis (US) and the IBZ between the C1 and C2 sclerotomes forms the lower dental synchondrosis (LS)
Fig. 15
Fig. 15
The severance line, which results in final cellular separation of the skull from the cervical spine, runs through the original resegmentation fronts of the adjacent somites 4 and 5, corresponding to the junction between the basion and apical segment of the dens in the axial proatlas, and between the exoccipital, or future occipital condyle, and the lateral mass of C1, derived from the lateral portion of the C1 resegmented sclerotome
Fig. 16
Fig. 16
The three developmental phases of the axis (C2) and the three waves of ossification. The primordia for the dens components are assembled during the membranous phase. Upper and lower dental synchondroses are shown as dense lines. First wave of ossification at fourth foetal month consists of bilateral centres for the neural arches and a single centre for the centrum. Second wave at sixth foetal month consists of bilateral ossification centres for the basal dental segment. At birth, the basal dental centres should have integrated in the midline and begun to be fused to the centrum. Third wave of C2 ossification occurs from 3 to 5 years post-natal life at the apical dental segment, which does not become fused to the basal dens till the 6–9th year, and fully formed during adolescence
Fig. 17
Fig. 17
State of ossification of the dens of a 4-year-old child. The tip of the basal dental segment is bicornuate from bilateral secondary ossification centres. Small density above this represents early third wave of ossification within the apical dental segment. Note lower dental synchondrosis (LS) in the coronal and sagittal views
Fig. 18
Fig. 18
Dens bicornis in a 7-year-old child. Lower synchondrosis has closed. Dens pivot is of normal height, suggesting the bifid tip is of the apical segment
Fig. 19
Fig. 19
Hox genes in mouse and human with their phylogenetic counterparts in Drosophila; 39 Hox genes are involved in the mouse and human vertebral column, found in four clusters of Hox A, B, C and D on four chromosomes (6, 11, 15 and 2), designated by Arabic numbers within each cluster and arranged as paralogues, so that the lower numbered Hox paralogues such as Hox a-1 and Hox d-1 are located on the anterior 3′ position of the chromosomes, and the higher numbered paralogues such as Hox a-13 and Hox d-13 are on the 5′ posterior position of the chromosomes. There is also temporal and structural colinearity with the embryonic axis so that the lower numbered paralogues are expressed earlier and more anterior on the embryonic axis than the higher numbered paralogues. (See colour match between genes and their expression domains on the embryonic axis.) Three sets of paralogues and their corresponding ancestral genes are designated by the grey bars
Fig. 20
Fig. 20
Expression domains of Hox genes lined up with the mouse embryonic vertebral column. Only the anterior expression boundary (in red) is important, and since multiple genes have the same anterior expression boundary along the prevertebral axis, each prevertebral segment has its own combination of Hox gene expression domains (Hox code). For example, the Hox code for C1 is Hox a-1, b-1, a-2, b-2, a-3, b-3, d-3 and d-4 (designated by the vertical green bar)
Fig. 21
Fig. 21
Anterior homeotic transformation. Mutation of the Hox d-3 gene in the mouse causes a caudal recession of its anterior expression domain (green arrow), allowing the Hox code of the C1 segment (green bar) to resemble that of an occipital somite (Note green bar representing C1 Hox Code has moved up to occipital sclerotome position). This renders the C1 sclerotome to “behave” like an occipital segment (symbolised in the figure by rostral movements of the C1 sclerotomes to a cranial position; see red arrows) and the anterior and posterior arches of C1 become fused to the basioccipital and exoccipital. Inset shows the human version of anterior homeotic transformation with assimilation of C1 to the occiput
Fig. 22
Fig. 22
Posterior homeotic transformation. “Gain-of-function” mutation of the murine Hox d-4 gene causes its anterior expression domain to extend cranially (yellow arrow), allowing the Hox code for the O4 segment (yellow bar) to resemble that of the C1 and C2 sclerotomes (yellow bar moved to C1 Hox code position) and render the basiocciput to “imitate” the C1 segment (symbolised in the figure by caudal movement of the C1 sclerotomes; see red arrows on the drawing). The inset shows the human version of posterior homeotic transformation: the basion (long arrow) is detached from the upper clivus (arrow head), and the C1 anterior arch (short arrow) is fused to the apical dens as if C1 is trying to become C2 by acquiring a “true centrum”
Fig. 23
Fig. 23
Complete agenesis of the dens in a 10-year-old child with spondyloepiphyseal dysplasia. a CT sagittal and coronal views show no dental pivot although the centrum with a flat top does rise up above the “expected” level of the lower dental synchondrosis. b 3-D CT reconstruction and MR show the flat top of the centrum and potential for instability
Fig. 24
Fig. 24
Agenesis of basal dental segment with a stumpy C2 centrum and a high-riding “floating” apical ossiculum (between arrows)
Fig. 25
Fig. 25
Agenesis of apical dental segment, with a slightly short dental pivot but a definite basal segment (pointed) and a lower dental synchondrosis (LS). Arrow points to anterior arch of C1. Note platybasia and Chiari I malformation
Fig. 26
Fig. 26
Os odontoideum in an 8-year-old child presented with multiple cerebellar and thalamic strokes. a Cerebral angiogram shows os odontoideum with a corrugated horn-like inferior edge (arrow) with anterior C1–C2 subluxation and stretch injury to the vertebral artery. b CT scans show multiple small infarcts of left cerebellar hemisphere and thalamus secondary to multiple vertebrobasilar emboli
Fig. 27
Fig. 27
Ossiculum terminale persistens (thin arrow), detached from the slightly shortened dental pivot formed by the basal dental segment (thick arrow)
Fig. 28
Fig. 28
Unstable os odontoideum with C1–C2 subluxation. a Widened ADI (13 mm) and a failed posterior C1–C2 fusion. b Another os with tall but jagged remaining dental pivot suggesting a traumatic aetiology
Fig. 29
Fig. 29
Unstable ossiculum terminale in a 2-year-old child with intermittent quadriparesis. a Flexion (upper) and extension (lower) sagittal reconstructed CTs showing highly mobile ossiculum (O) and C1 with obvious translational subluxation. b Sagittal T2 MRI shows C1 cord compression and T2 signal changes in the cord. c Post-operative sagittal CT (left) and MRI (right) showing resection of C1 posterior arch, reduced C1–C2 subluxation after bone grafts (G) and inside–outside screw plate occipital–C2–C3 fusion. MRI (right) shows restored width of the upper cervical canal and relief of cord compression. O ossiculum terminale, C 1 anterior arch of C1
Fig. 30
Fig. 30
Case 1: 10-year-old boy with ossiculum terminale. a Flexion–extension CT shows highly mobile ossiculum and anterior subluxation. The ossiculum terminale (O) forms a joint (arrow) with the posterior surface of the anterior arch of C1 (C 1). Both C1 and ossiculum move together as one unit. b Sagittal MR in neutral position shows narrowing of upper cervical canal. c After maximum intraoperative reduction and partial resection of the C1 posterior arch, the occiput is fused to C2 and C3 using a screw plate and contoured upright rods. d Post-operative plain film (left side) and CTs (right side) show the C2 transarticular screws to include the lateral mass of C1 and the C3 lateral mass screws. Note the three occipital screws through the thick mid-occipital keel for the occipital plate
Fig. 31
Fig. 31
Os avis with severe posterior subluxation of skull and C1 on C2 producing quadriparesis. a The bone directly above the dental pivot is in fact a posteriorly shifted C1 anterior arch (C 1). The os avis (OA) is just behind the C1 arch and is attached to the clivus marked by the arrow. Note posteriorly shifted posterior arch of C1. b Flexion–extension polytomography shows relationship between C1 arch, clivus and os avis. Note attachment of the os with the clivus tip (arrow) and the unchanging (fixed) relationship with the clivus during flexion and extension. c CT myelogram shows spinal cord compression by the os avis during extension. Arrow marks attachment of os avis to clival tip
Fig. 32
Fig. 32
Undescended apical dens still fused to the clivus (os avis). The dental pivot has a flat top but tall enough for the TAL and has no instability. Other anomalies such as multiple vertebral centra fusion, basilar invagination of the opisthion and stenosis by C1 posterior arch cause compressive myelopathy
Fig. 33
Fig. 33
Completely bifid dens. a Note complete lack of midline integration of basal dental segment down to lower dental synchondrosis and an unfused and forward dislocated apical dens, suggesting midline integration abnormality interferes with growth and fusion of adjacent upper dental synchondrosis. b Flexion–extension CT shows C1–C2 instability. c Sagittal MR shows severe cord compression with flexion. Arrow points to small ossiculum
Fig. 34
Fig. 34
Illustrative case 2: 6-year-old boy with absent midline integration of basal dental segment. a Non-fusion of right “hemi-os” to the C2 centrum suggests interference with adjacent dental synchondrosis fusion. Note bifid C3 centrum and fusion of C2 and C3 centra. b Floating hemi-os (arrow) on the axial CT (left) and backward “popping” of the hemi-os with cord compression on MRI (right). c Incision for midline mandibulotomy. d Step osteotomy of midline mandibulotomy for perfect re-attachment. e Left : difficulty in exposing the posterior pharynx even after mandibulotomy. Right : both the tongue and part of the mylohyoid have to be split in the middle to expose the posterior pharynx. f Left : exposure of the posterior pharynx after splitting the soft palate. Right : exposure of the anterior C1 arch after incising the pharyngeal mucosa. g Odontoid resection. Left : subperiosteal exposure of the C1 anterior arch. Middle : after drilling off the middle portion of the C1 arch, the floating hemi-os is exposed. The fixed left hemi-os has been partially removed. Right : after removal of both the floating and fixed hemi-os, the transverse atlantal ligament (TAL) is exposed. h Post-operative axial CT showing complete removal of the mobile right hemi-os and most of the fixed hemi-os on the left
Fig. 34
Fig. 34
Illustrative case 2: 6-year-old boy with absent midline integration of basal dental segment. a Non-fusion of right “hemi-os” to the C2 centrum suggests interference with adjacent dental synchondrosis fusion. Note bifid C3 centrum and fusion of C2 and C3 centra. b Floating hemi-os (arrow) on the axial CT (left) and backward “popping” of the hemi-os with cord compression on MRI (right). c Incision for midline mandibulotomy. d Step osteotomy of midline mandibulotomy for perfect re-attachment. e Left : difficulty in exposing the posterior pharynx even after mandibulotomy. Right : both the tongue and part of the mylohyoid have to be split in the middle to expose the posterior pharynx. f Left : exposure of the posterior pharynx after splitting the soft palate. Right : exposure of the anterior C1 arch after incising the pharyngeal mucosa. g Odontoid resection. Left : subperiosteal exposure of the C1 anterior arch. Middle : after drilling off the middle portion of the C1 arch, the floating hemi-os is exposed. The fixed left hemi-os has been partially removed. Right : after removal of both the floating and fixed hemi-os, the transverse atlantal ligament (TAL) is exposed. h Post-operative axial CT showing complete removal of the mobile right hemi-os and most of the fixed hemi-os on the left
Fig. 35
Fig. 35
Bifid clivus. a Left: Axial CT shows the gap in the lower clivus (arrow). Right: Sagittal CT shows the odontoid process is far anterior to its usual position below the clivus. Fusion of the C2, C3 and C4 centra is also seen. b CT 3-D rendering of the skull base. Left: View from the back shows widely bifid basiocciput and an oval defect (arrow) higher in the clivus. The posterior C1 arch is deficient. Right: view from the front shows the odontoid is far forward from the bifid clivus (mostly covered by the dens), and the anterior C1 arch is also bifid. Note upper clival defect (arrow). Incom post C 1 arch incomplete posterior C1 arch; Incom ant C 1 arch incomplete anterior C1 arch
Fig. 36
Fig. 36
Radiographic criteria for basilar impression. 1 McGregor’s line between hard palate (HP) and the lowest point of occiput. Basilar impression is present if the dens protrudes >5 mm above this line. 2 Chamberlain’s line between hard palate and opisthion. Positive diagnosis if dens protrudes >2.5 mm above line. 3 McRae’s line between basion and opisthion should be above the dens. 4 Klaus index, distance between tip of dens and the tuberculum–cruciate line between tuberculum (T) and internal occipital protuberance (IP). This measures depth of the posterior fossa
Fig. 37
Fig. 37
Normal clival angle (top) measured by the NTB angle of Welcker joining the nasion (N), tuberculum (T) and basion (B). The angle should be less than 130°. Platybasia (middle) is marked by an increased NTB angle. This raises the basion and forces the foramen magnum plane (dotted line) to tilt upwards. The same upward tilt of this plane also occurs with a short clivus (lower)
Fig. 38
Fig. 38
Severe lordotic tilting of the plane of the occipital condyle in short clivus (upper) and platybasia (lower). Normal clivus and opisthion are represented by dotted outlines, and orientation and plane of the occipital condyle are represented by arrow and semi-circle, respectively; red for normal and black for abnormal
Fig. 39
Fig. 39
Anterior form of basilar impression caused by an exceedingly short (<1 cm) and blunted clivus (arrow) with severe lordotic tilt of the plane of the foramen magnum, leading to a “sympathetic” lordotic bend of the dental pivot resulting in a retroflexed odontoid and basilar impression
Fig. 40
Fig. 40
Illustrative case 3 of the posterior form of basilar impression. A 12-year-old girl with occipital headache, neurogenic dysphagia and right hemiparesis. a CT of CVJ. Left : coronal CT shows severely up-slanting and elevated left occipital condyle–C1 joint (arrows). C4 is a hemi-vertebra. Right : sagittal CT shows invagination of the opisthion (Op) (basilar invagination). The posterior arch of C1 is assimilated into the posterior rim of the foramen magnum. Note slightly high-riding odontoid but absence of platybasia, short clivus or retroflexed dens. b Sagittal and axial MRI shows compression of the medulla by the invaginating opisthion and syringomyelia. c Intraoperative picture showing the invaginating opisthion and the rotated and knobbly spinous processes of C2 and C3. d The inside–outside screw plate with a slender sublaminar lower plate designed for sublaminar cable application for very young children. e Different inside–outside screws with different plate diameters (8–12 mm), screw-stem lengths (10–14 mm) and centre or off-set stems. The nut is shown with one of the screws. f Key holes in the occipital bone cut for insertion of the inside–outside screw. Note the invaginating opisthion lip has been removed. g Insertion of the inside–outside screw in holder. h Inside–outside screw (I–O screw) and plates in place with sublaminar cable round the laminae of C2 and C3 . i Onlaid cortical and cancellous bone grafts (G) in place. j 3-D rendition of the fusion site at CVJ with the inside–outside screw (I–O screw) plates (I–O plate). Right picture and inset show subtracted CT 3-D images of the screw plates and sublaminar cables. k Post-operative CT. Left shows removal of the invaginating opisthion (arrow) and onlaid bone grafts (G). Right upper shows the inside–outside screw plate assembly with the flat screw head pointing inwards and the screw stem (I–O S) outwards. Right lower shows axial CT of the decompressed foramen magnum
Fig. 40
Fig. 40
Illustrative case 3 of the posterior form of basilar impression. A 12-year-old girl with occipital headache, neurogenic dysphagia and right hemiparesis. a CT of CVJ. Left : coronal CT shows severely up-slanting and elevated left occipital condyle–C1 joint (arrows). C4 is a hemi-vertebra. Right : sagittal CT shows invagination of the opisthion (Op) (basilar invagination). The posterior arch of C1 is assimilated into the posterior rim of the foramen magnum. Note slightly high-riding odontoid but absence of platybasia, short clivus or retroflexed dens. b Sagittal and axial MRI shows compression of the medulla by the invaginating opisthion and syringomyelia. c Intraoperative picture showing the invaginating opisthion and the rotated and knobbly spinous processes of C2 and C3. d The inside–outside screw plate with a slender sublaminar lower plate designed for sublaminar cable application for very young children. e Different inside–outside screws with different plate diameters (8–12 mm), screw-stem lengths (10–14 mm) and centre or off-set stems. The nut is shown with one of the screws. f Key holes in the occipital bone cut for insertion of the inside–outside screw. Note the invaginating opisthion lip has been removed. g Insertion of the inside–outside screw in holder. h Inside–outside screw (I–O screw) and plates in place with sublaminar cable round the laminae of C2 and C3 . i Onlaid cortical and cancellous bone grafts (G) in place. j 3-D rendition of the fusion site at CVJ with the inside–outside screw (I–O screw) plates (I–O plate). Right picture and inset show subtracted CT 3-D images of the screw plates and sublaminar cables. k Post-operative CT. Left shows removal of the invaginating opisthion (arrow) and onlaid bone grafts (G). Right upper shows the inside–outside screw plate assembly with the flat screw head pointing inwards and the screw stem (I–O S) outwards. Right lower shows axial CT of the decompressed foramen magnum
Fig. 41
Fig. 41
Combined anterior–posterior form of basilar impression. a Sagittal CT shows extreme platybasia (NTB angle = 180°), short clivus (<1.5 cm) and forward folding of the clivus–axis angle of Wackenheim (80°), causing lordotic tilt of the foramen magnum plane and plane of the occipital condyles, resulting in a retroflexed dens and severe basilar impression. Note violation of McGregor’s, Chamberlain’s and McRae’s lines by the dens. Also, extreme invagination of the opisthion (O) and high posterior C1 arch (C 1). b Sagittal MR shows distortion and compression of brainstem by both the dens and the opisthion
Fig. 42
Fig. 42
Platybasia and short clivus (<1.5 cm; sphenoclival synchondrosis marked by arrow) causing severe basilar impression and mild retroflexed dens. This results in a shallow posterior fossa with a Klause index (K) of less than 1.8 cm and ectopic cerebellar tonsils and cervical syringomyelia
Fig. 43
Fig. 43
Platybasia in a 9-year-old child with no symptoms. The clivus–axis angle (of Wackenheim) is about 100°. No CVJ compression is present
Fig. 44
Fig. 44
A 12-year-old girl with retroflexed dens, mild basilar impression and Chiari I malformation. a Pre-operative clivus–axis angle (of Wackenheim) of 130°. b Post-operative cranial settling causing forward folding of Wackenheim’s angle to 110° and shortening of dens–basion interval (DBI). Note worsened anterior brain stem compression. c Caliper traction (left) for 4 days followed by C1–C2 Goel-Harm’s screw plate posterior fusion. d Post-fusion reversal of Wackenheim’s angle to 138° and increase of DBI to 1.8 cm. Note relief of brainstem compression and symptoms
Fig. 45
Fig. 45
Pre-basioccipital arch (thin arrows), a U-shaped bony valance on the ventral lip of the anterior foramen magnum rim. This results from complete preservation of the hypochordal bow of the proatlas
Fig. 46
Fig. 46
Third occipital condyle or condylus tertius (thin arrow) attached to the ventral surface of the clival tip and fused to the anterior atlantal arch (thick arrow). On MRI, the condyle appears to form a synovial joint with an ossiculum terminale that is unfused to the basal dens. The third occipital condyle represents midline hyperplasia of the proatlas hypochordal bow
Fig. 47
Fig. 47
A short third occipital condyle (arrow) curving forward from the clival tip away from the foramen magnum
Fig. 48
Fig. 48
Unilateral hyperplasia of the occipital condyle (arrow) with cervicomedullary distortion. This represents hyperplasia of the exoccipital (lateral) sclerotome of the proatlas
Fig. 49
Fig. 49
C1 assimilation or occipitalization. a Assimilation of the anterior atlantal arch (zone 1 assimilation). b Assimilation of the lateral masses (zone 2 assimilation). c Posterior arch (zone 3) assimilation
Fig. 50
Fig. 50
Unfused clivus to basioccipital. The clivus or lower basioccipital segment (thin arrow) is unfused to the upper basioccipital segment, which is attached to the sphenoid bone at the spheno-occipital synchondrosis (arrow head). The anterior atlantal arch (thick arrow) is fused to the apical dens to form a “pseudo-centrum” for C1. This may represent posterior homeotic transformation
Fig. 51
Fig. 51
Complete aplasia of C1 hypochordal bow—complete aplasia of C1 anterior arch. a CT and 3-D reconstruction shows no anterior atlantal arch or insertion tubercles for the TAL. The two anterior stunted dental hemi-os (arrow) are unfused to the C2 centrum. Posterior arch of C1 is also unfused. b Extreme C1–C2 flexion instability and severe cord compression
Fig. 52
Fig. 52
Severe hypoplasia of C1 hypochordal bow—small anterior C1 arch. a Match-head size anterior C1 arch (thick arrow) associated with complete agenesis of the dens (thin arrow), a result of concomitant C1 centrum aplasia. b C1–C2 instability with cord compression
Fig. 53
Fig. 53
Complete agenesis of posterior atlantal arch and bifid anterior atlantal arch. Normal TAL insertion tubercles (arrows). There is no C1–C2 instability
Fig. 54
Fig. 54
Unilateral aplasia of the right posterior arch of C1
Fig. 55
Fig. 55
Partial agenesis of posterior atlantal arch. a The posterior tubercle and arch remnant appear floating and unconnected to the lateral masses. b, c Flexion and extension shows ample tilting of the lateral masses away from the posterior tubercle (arrows), suggesting absence of a cartilaginous mold. In spite of this tilting, there is no translational instability
Fig. 56
Fig. 56
Combined anterior and posterior atlantal arch defects
Fig. 57
Fig. 57
Unilateral lateral mass aplasia in a 2-year-old with fixed right head tilt. a Left: Coronal CT shows aplasia of the right lateral mass. There is no real condyle–cervical articulation on the right side (arrow). Left Oc–C1 joint is present. Right: aplasia of right posterior arch and complete aplasia of the anterior arch. C 1 left C1 lateral mass, Oc occipital condyle. b 3-D rendering of the cervical spine from the front. Left lateral mass and left posterior arch of C1 (L Post Arch) are seen, but there is no equivalent structures on the right side except for a small ossified bead-like structure (arrow) lateral to the lateral mass of C2. Note intact condyle–C1 joint on the left but free-floating occipital condyle on the right. Anterior C1 arch is also absent. c Sagittal CT reconstruction showing intact articulation between left occipital condyle (Oc) and C1 lateral mass (C 1). Right condyle is free floating
Fig. 58
Fig. 58
Bifid anterior and posterior atlantal arches
Fig. 59
Fig. 59
Bifid posterior atlantal arch with hyperplasia and inward curling of the free ends (arrows) of the open arch. There is some narrowing of the spinal canal and slight indentation of the posterior surface of the cord

References

    1. Aoyoma H, Asamoto K. Determination of somite cells: independence of cell differentiation and morphogenesis. Development. 1988;104:15–28. - PubMed
    1. Bagnall KM. The migration and distribution of somite cells after labelling with the carbocyanine dye, DiI: the relationship of this distribution to segmentation in the vertebrate body. Anat Embryol (Berl) 1992;185:317–324. doi: 10.1007/BF00188544. - DOI - PubMed
    1. Bagnall KM, Sander EJ. The binding pattern of peanut lectin associated with sclerotome migration and the formation of the verteral axis in the chick embryo. Anat Embryol (Berl) 1989;180:505–513. doi: 10.1007/BF00305126. - DOI - PubMed
    1. Bellairs R. The segmentation of somites in the chick embryo. Bolletino di zoologia. 1980;47:245–252.
    1. Burwood RJ (1970) The cranio-cervical junction. Anatomy. Thesis. University of Bristol

MeSH terms