. 2011 Feb 15;50(6):1001-15.
doi: 10.1021/bi101822y. Epub 2011 Jan 24.

Sulfated glycosaminoglycans accelerate transthyretin amyloidogenesis by quaternary structural conversion

Affiliations

Sulfated glycosaminoglycans accelerate transthyretin amyloidogenesis by quaternary structural conversion

Steve Bourgault et al. Biochemistry. .

Abstract

Glycosaminoglycans (GAGs), which are found in association with all extracellular amyloid deposits in humans, are known to accelerate the aggregation of various amyloidogenic proteins in vitro. However, the precise molecular mechanism(s) by which GAGs accelerate amyloidogenesis remains elusive. Herein, we show that sulfated GAGs, especially heparin, accelerate transthyretin (TTR) amyloidogenesis by quaternary structural conversion. The clustering of sulfate groups on heparin and its polymeric nature are essential features for accelerating TTR amyloidogenesis. Heparin does not influence TTR tetramer stability or TTR dissociation kinetics, nor does it alter the folded monomer-misfolded monomer equilibrium directly. Instead, heparin accelerates the conversion of preformed TTR oligomers into larger aggregates. The more rapid disappearance of monomeric TTR in the presence of heparin likely reflects the fact that the monomer-misfolded amyloidogenic monomer-oligomer-TTR fibril equilibria are all linked, a hypothesis that is strongly supported by the light scattering data. TTR aggregates prepared in the presence of heparin exhibit a higher resistance to trypsin and proteinase K proteolysis and a lower exposure of hydrophobic side chains comprising hydrophobic clusters, suggesting an active role for heparin in amyloidogenesis. Our data suggest that heparin accelerates TTR aggregation by a scaffold-based mechanism, in which the sulfate groups comprising GAGs interact primarily with TTR oligomers through electrostatic interactions, concentrating and orienting the oligomers, facilitating the formation of higher molecular weight aggregates. This model raises the possibility that GAGs may play a protective role in human amyloid diseases by interacting with proteotoxic oligomers and promoting their association into less toxic amyloid fibrils.


Figures
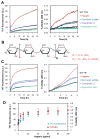
FIGURE 1
FIGURE 1
Influence of glycosaminoglycans on WT TTR and M-TTR aggregation kinetics. (A) WT TTR aggregation was assessed by the increase of ThT fluorescence (left panel) or the increase in turbidity at 400 nm (right panel). WT TTR (0.2 mg/mL) was incubated in 200 mM acetate buffer, pH 4.8, 37 °C, in the absence (black) or in presence of 20 μg/mL of heparin (red), dermatan sulfate (blue), chondroitin C (purple), or hyaluronic acid (green). (B) Representative structure of heparin composed of glucuronic acid (GlcA) linked to glucosamine (GlcN) disaccharide repeating subunit. R1 could be –H or –SO3 whereas R2 could be –H, –SO3 or – COCH3. (C) M-TTR aggregation assessed by ThT fluorescence and turbidity at 400 nm using the same conditions as in (A) and presented analogously. (D) M-TTR (0.2 mg/mL) was incubated in 200 mM acetate buffer, pH 4.8, 37 °C, for 30 h in the presence of increasing heparin concentrations (1 to 100 μg/mL) and the aggregation was assessed by ThT fluorescence (blue diamonds) and turbidity at 400 nm (red squares) at the end of the 30 h incubation period. For turbidity reading, samples were agitated for 5 sec before the reading.
FIGURE 2
FIGURE 2
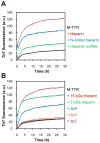
Effects of heparin sulfation state and molecular weight on heparin-accelerated M-TTR aggregation. (A) M-TTR (0.2 mg/mL) was incubated in 200 mM acetate buffer, pH 4.8, 37 °C, in the absence (black) or in presence of 20 μg/mL of heparin (red), N-Acetyl-heparin (blue) or heparan sulfate (green). (B) M-TTR (0.2 mg/mL) was incubated in 200 mM acetate buffer, pH 4.8, 37 °C, in the absence (black) or in presence of 20 μg/mL of 15 kDa heparin (red), 5 kDa heparin (green), 8 saccharide unit heparin (dp8, blue), 4 saccharide unit heparin (dp4, orange) or UA,2S – GlcNS,6S disaccharide (dp2, purple).
FIGURE 3
FIGURE 3
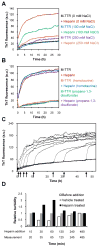
Effect of salt concentration, glycosaminoglycan mimetics and time of heparin addition on heparin-accelerated M-TTR aggregation. (A) M-TTR (0.2 mg/mL) was incubated in 200 mM acetate buffer, pH 4.8, 37 °C, in the absence (black, blue, purple) or in the presence of 20 μg/mL heparin (red, green, orange). NaCl concentration was adjusted to 250 mM (orange, purple), 100 mM (green, blue) or 0 mM (red, black), respectively. (B) M-TTR (0.2 mg/mL) was incubated in 200 mM acetate buffer, pH 4.8, 37 °C, in the absence (black, red) or in presence of 100 μg/mL homotaurine (blue, orange) or 100 μg/mL propane-1-3-disulfonate (purple, green). Heparin, at a concentration of 20 μg/mL, was added (red, blue, purple) or not (black, green, orange). (C) M-TTR (0.2 mg/mL) was incubated in 200 mM acetate buffer, pH 4.8, 37 °C and 20 μg/mL heparin was added at different times after the start of the M-TTR aggregation, indicated by the arrows. (D) M-TTR (0.2 mg/mL) was incubated in 200 mM acetate buffer, pH 4.8, 37°C. At different times (15, 30, 60, 120, 240 and 480 min; x axis), after the start of M-TTR aggregation, 20 μg/mL heparin or water (vehicle) was added. Immediately before the heparin or vehicle addition, samples were gently vortexed and optical density was measured (white bars, before addition). After heparin or vehicle addition, quiescent incubation at 37°C was resumed for 5 additional min and then turbidity was measured after mild vortexing (vehicle treated samples depicted by gray bars, whereas heparin treated samples are represented by black bars). The relative turbidity in M-TTR samples without heparin addition (vehicle treated, gray bars) was assigned to be unity.
FIGURE 4
FIGURE 4
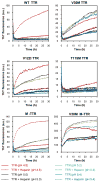
Influence of TTR kinetic and/or thermodynamic stability on heparin-accelerated aggregation. TTR (0.2 mg/mL) variants were incubated in 200 mM acetate buffer, 37°C, in the absence (full line) or presence (dashed line) of 20 μg/mL heparin. The pH was adjusted to 4.8 (red), 5.0 (black), 5.2 (green) or 5.4 (blue).
FIGURE 5
FIGURE 5
Effect of heparin on acid induced M-TTR tertiary and/or quaternary structural changes. (A, B) Far UV CD spectra of 0.2 mg/mL M-TTR samples aggregated without (A) or with 20 μg/mL heparin (B) in 200 mM acetate buffer, pH 4.8, 37 °C. Spectra were read at 0 (black), 15 (purple), 30 (green), 60 (orange), 120 (red) and 240 min (blue) after the beginning of the acid-mediated aggregation process. Time 0 min (black) corresponds to a pH 7.6 control. (C) M-TTR was incubated in 200 mM acetate buffer, pH 4.8, at 37 °C in presence of 20 μg/mL heparin at a M-TTR concentration of 0.3 (blue), 0.25 (red), 0.2 (green), 0.15 (purple) or 0.1 mg/mL (orange). (D) Dependence of M-TTR conformational change rates on M-TTR concentration in presence of 20 μg/mL heparin. The change in the β-sheet signal measured at 218 nm, reported in C, was analyzed using a best fit procedure. k1 (▲) and k2 (■) are first order rate constants of the apparent first and second phase of the structural changes, respectively, obtained with a procedure of best fit, using the single exponential function (θ = Ax × exp(−kxt) + θplateau).
FIGURE 6
FIGURE 6
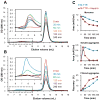
Influence of heparin on M-TTR aggregation monitored by analytical gel filtration chromatography. (A and B) Chromatograms of M-TTR (0.2 mg/mL) at pH 4.8, 37 °C, in the absence of heparin (A) or in presence of 20 μg/mL heparin (B) obtained after 0 (red), 30 (blue), 60 (green), 120 (orange), 180 (purple) and 240 min (black). The insets show the same data with an expanded OD scale to emphasize the differences in the peak area corresponding to the soluble aggregates. (C) Integration of monomer and soluble aggregate (void volume) peaks as well as the aggregates retained by the 0.22 μM PVDF membrane filter (expressed as protein recovery (%)) reported as a function of time into the aggregation reaction performed in absence (●) or in presence of 20 μg/mL of heparin (■).
FIGURE 7
FIGURE 7
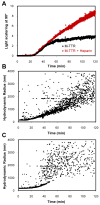
Effect of heparin on M-TTR aggregation monitored by dynamic light scattering. (A) M-TTR (0.2 mg/mL) was incubated in 200 mM acetate buffer pH 4.8, 37 °C, in the absence (black) or presence (red) of 20 μg/mL heparin. The light scattering intensity at 90° was measured every 2 sec. (B, C) Hydrodynamic radius (Rh) assessment of M-TTR aggregation as a function of time preformed in the absence (B) or presence (C) of heparin. Rh was calculated using the Astra software package from Wyatt Technology.
FIGURE 8
FIGURE 8
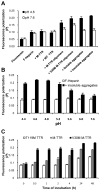
Interactions between various states of TTR and heparin assessed by fluoresceinated-heparin fluorescence polarization measurements. (A) 20 μg/mL of fluoresceinated-heparin (F-Heparin) was incorporated into a 0.2 mg/mL TTR solution (various states) at pH 7.6 (white) or the pH was adjusted to 4.8 (black) and the fluorescence polarization was immediately measured. Purified oligomers, large soluble aggregates and fibrils were prepared as described in the experimental procedures section. (B) 20 μg/mL of fluoresceinated-heparin (F-Heparin) was mixed with 0.2 mg/mL of TTR fibrils (black) or not (white) as a function of pH and the fluorescence polarization was immediately measured. (C) T119M TTR (white), M-TTR (gray) or V30M M-TTR (black) at 0.2 mg/mL were incubated in 200 mM acetate buffer pH 4.8, 37 °C, in presence of 20 μg/mL fluoresceinated-heparin and the fluorescence polarization was measured as a function of time.
FIGURE 9
FIGURE 9
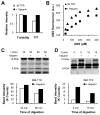
Influence of heparin on the structural properties of aggregates derived from M-TTR. (A) M-TTR aggregates grown for 5 days at pH 4.8, 37°C, in the absence (white) or presence (black) of 20 μg/mL heparin and isolated by centrifugation, were resuspended in buffer A at a final concentration of 0.2 mg/mL and the absorbance at 400 nm (turbidity) was measured as well as the ThT fluorescence in presence of 20 μM ThT. Results are expressed relative to the M-TTR fibrils obtained in presence of heparin (black bars assigned to be unity) monitored by either ThT fluorescence and turbidity. (B) ANS binding to 0.2 mg/mL M-TTR aggregates prepared in the absence (▲) or presence (■) of 20 μg/mL heparin. The ANS fluorescence intensity was measured at 470 nm. (C) Trypsin digestion of M-TTR aggregates formed in the absence or presence of heparin (20 μg/mL). Aggregates were incubated with trypsin at an enzyme-to-substrate ratio of 1:200 (w/w) at 37°C for 30 min or 60 min and then analyzed by SDS-PAGE. The bands corresponding to uncleaved M-TTR (14 kDa) detected by Coomasie blue staining were quantified (bottom). (D) Proteinase K digestion of M-TTR aggregates formed in the absence or presence of heparin. Aggregates were incubated with Proteinase K at a ratio of 1:2000 (w/w) at 25°C for 5 min or 15 min and then analyzed by SDS-PAGE. The bands corresponding to a high molecular weight M-TTR fragment (≈13 kDa) detected by Coomasie blue staining were quantified (bottom).
FIGURE 10
FIGURE 10
Schematic representation of the proposed mechanism by which sulfated glycosaminoglycans accelerate transthyretin amyloidogenesis. In the proposed mechanism supported by our data, as described in the text, GAGs do not influence the initial steps of the TTR amyloidogenesis cascade, including tetramer dissociation, partial misfolding of the released monomer to form the amyloidogenic monomer, or the initial formation of TTR oligomers. Instead, the sulfated polymeric surface of GAGs interact with TTR oligomers, primarily through electrostatic interactions, concentrating TTR oligomers and possibly orienting them so as to accelerate the formation of larger aggregates by quaternary structural conversion.

References

    1. Buxbaum JN. The systemic amyloidoses. Curr Opin Rheumatol. 2004;16:67–75. - PubMed
    1. Chiti F, Dobson CM. Protein misfolding, functional amyloid, and human disease. Annu Rev Biochem. 2006;75:333–366. - PubMed
    1. Kelly JW. The alternative conformations of amyloidogenic proteins and their multistep assembly pathways. Curr Opin Struct Biol. 1998;8:101–106. - PubMed
    1. Dobson CM. Protein folding and misfolding. Nature. 2003;426:884–890. - PubMed
    1. Cohen FE, Kelly JW. Therapeutic approaches to protein-misfolding diseases. Nature. 2003;426:905–909. - PubMed

Publication types