. 2010 Dec 31:11:731.
doi: 10.1186/1471-2164-11-731.

Smed454 dataset: unravelling the transcriptome of Schmidtea mediterranea

Affiliations

Smed454 dataset: unravelling the transcriptome of Schmidtea mediterranea

Josep F Abril et al. BMC Genomics. .

Abstract

Background: Freshwater planarians are an attractive model for regeneration and stem cell research and have become a promising tool in the field of regenerative medicine. With the availability of a sequenced planarian genome, the recent application of modern genetic and high-throughput tools has resulted in revitalized interest in these animals, long known for their amazing regenerative capabilities, which enable them to regrow even a new head after decapitation. However, a detailed description of the planarian transcriptome is essential for future investigation into regenerative processes using planarians as a model system.

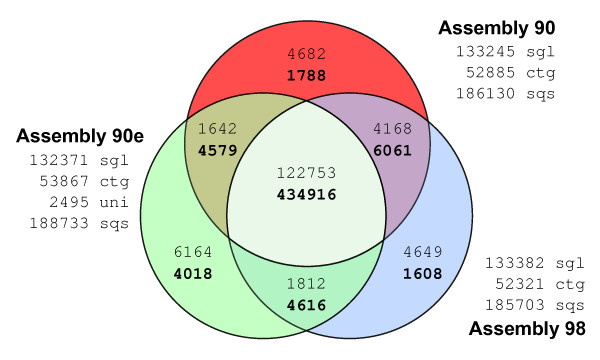
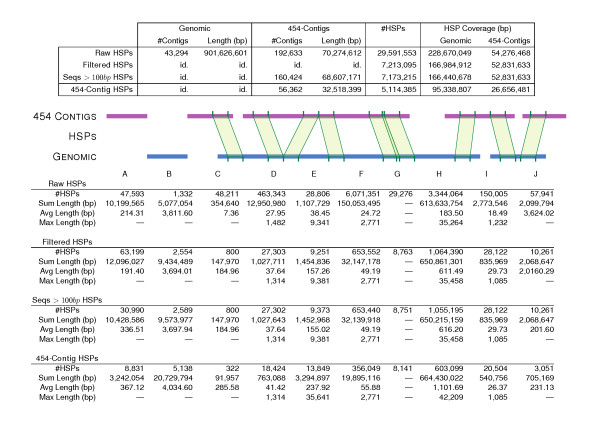
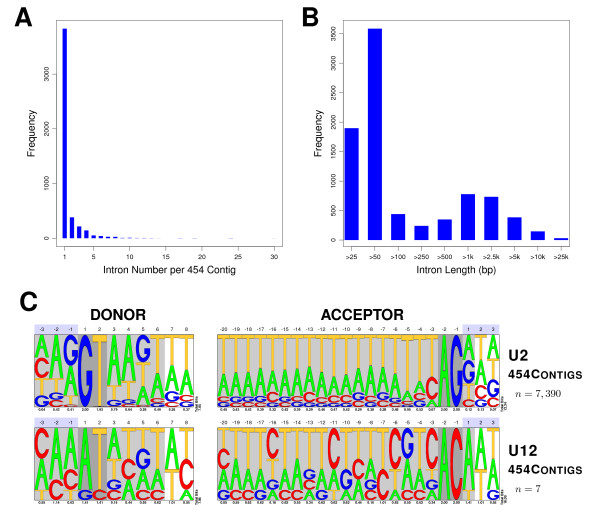
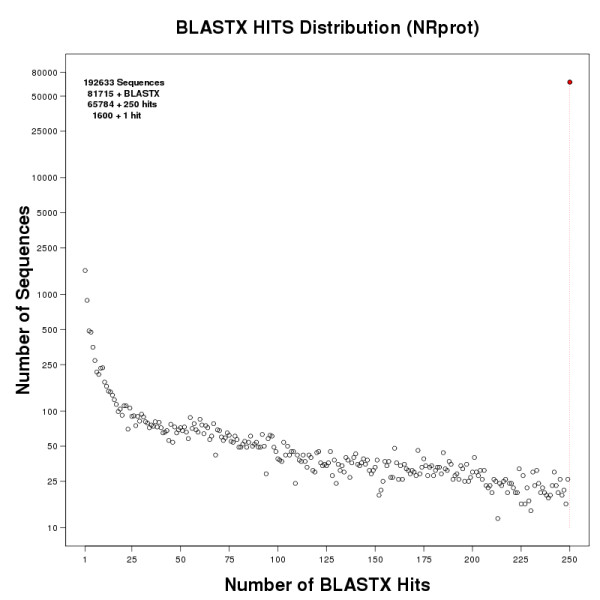
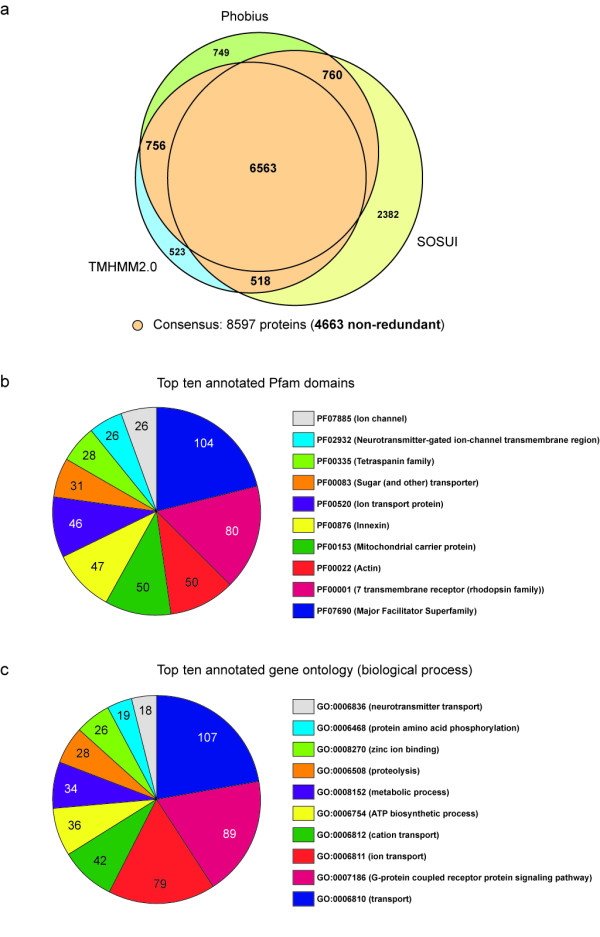
Results: In order to complement and improve existing gene annotations, we used a 454 pyrosequencing approach to analyze the transcriptome of the planarian species Schmidtea mediterranea Altogether, 598,435 454-sequencing reads, with an average length of 327 bp, were assembled together with the ~10,000 sequences of the S. mediterranea UniGene set using different similarity cutoffs. The assembly was then mapped onto the current genome data. Remarkably, our Smed454 dataset contains more than 3 million novel transcribed nucleotides sequenced for the first time. A descriptive analysis of planarian splice sites was conducted on those Smed454 contigs that mapped univocally to the current genome assembly. Sequence analysis allowed us to identify genes encoding putative proteins with defined structural properties, such as transmembrane domains. Moreover, we annotated the Smed454 dataset using Gene Ontology, and identified putative homologues of several gene families that may play a key role during regeneration, such as neurotransmitter and hormone receptors, homeobox-containing genes, and genes related to eye function.

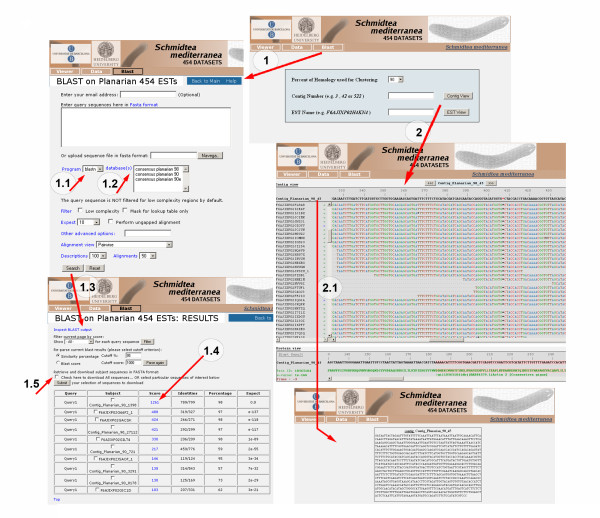
Conclusions: We report the first planarian transcript dataset, Smed454, as an open resource tool that can be accessed via a web interface. Smed454 contains significant novel sequence information about most expressed genes of S. mediterranea. Analysis of the annotated data promises to contribute to identification of gene families poorly characterized at a functional level. The Smed454 transcriptome data will assist in the molecular characterization of S. mediterranea as a model organism, which will be useful to a broad scientific community.


Figures

Figure 1
Figure 1
Overlap-analysis of Smed454 assemblies. Comparison of the 454-sequencing reads taken into account to build each Smed454 dataset. Venn-diagram numbers in plain format correspond to singleton reads, while numbers in bold correspond to sequencing reads that were assembled into Contigs. About 4,000 raw reads where split into two or more fragments, due to quality clipping. However, only distinct raw read identifiers, after removing the fragment suffix, were used to produce this figure. sgl: total number of singletons for that assembly; ctg: total number of contigs; uni: number of NCBI Unigene sequences not assembled into a contig (90e only); sqs: total number of sequences for a given dataset.
Figure 2
Figure 2
GC content and length distributions of different assemblies. Violin plots show the distribution of frequencies of a given variable in different datasets using a density kernel estimator [71]. White marks on the violin plots indicate the median value for a given variable, and the red points indicate the mean. The thick line marks the 25/75% inter-quartile range. GC content (left panel) distribution is quite similar in all the datasets, with higher frequencies around 35%. Nucleotide length (right panel) highlights the major differences between un-assembled (NCBI ESTs and the 454 raw reads) and assembled (NCBI UniGene, 90, 98 and 90e) sets. The last four plots (light blue) show the length distribution for the component subsets of the 90e assembly.
Figure 3
Figure 3
Distribution of different HSP types from 90e over genome sequences. The top table shows the total number of similarity hits, while the bottom table classifies the hits into different types of HSPs: A) 454 contigs not mapping to a genomic sequence; B) genomic contigs not mapping to a 454 contig; C and J) 454 contigs with an unmapped sequence on the left and right, respectively; D) missing sequence on 454 contigs corresponding to a putative gap in the assembly; E) contiguous HSPs on 454 contigs related to a genomic intron; F) co-linear unmapped sequences on both sequence sets; G) contiguous overlapping HSPs defining a larger similarity segment; H) unaligned genomic sequences between HSPs of two different 454 contigs, which can be interpreted as putative intergenic sequences; I) HSPs on 454 contigs supporting a pair of genomic contigs, which could then be merged into a larger genomic scaffold. All columns show HSP numbers--the '#HSPs' row--except for A and B, which correspond to number of sequences.
Figure 4
Figure 4
Analysis of intronic features and splice sites on a set of 90e contigs. A) Distribution of the number of putative introns per 90e contig. B) Length distribution of putative introns. C) Pictograms summarizing the consensus donor and acceptor splice sites for the predicted introns. n corresponds to the number of intron sequences used to compute the nucleotide position weight matrices for the pictograms. Light grey shadowed regions correspond to the commonly used signal lengths for gene-finding, while dark grey ones define the nucleotide boundaries of the introns. Numbers below pictograms are the bit-scores that describe the information content per position.
Figure 5
Figure 5
The content of the Smed454 web site. Screenshots of the pages that facilitate access to the three sequence assemblies (90, 98 and 90e), including the page displaying alignments of raw reads. A BLAST interface, adapted from NBCI's toolkit, is also available for querying the sequences from the datasets. The web site is available at http://planarian.bio.ub.es/datasets/454/
Figure 6
Figure 6
Distribution of BLASTXhits of 90e sequences against NCBI NRprot. Sequences from the 90e dataset were compared against the NCBI NR protein database using BLASTX. The figure shows the distribution of the number of sequences binned by the number of HSPs they had. Y-axis in log scale.
Figure 7
Figure 7
Prediction of planarian transmembrane proteins and functional annotations. A) Venn-diagram showing the overlap between predictions of transmembrane proteins generated by the Phobius, TMHMM2.0 and SOSUI programs for a set of 56,362 protein sequences translated from planarian ESTs. Only proteins predicted to contain one or more transmembrane domains by at least two programs (colored orange, 8,597 proteins, of which 4,663 are non-redundant) were considered for further analysis. B) Top ten PFAM domains and C) gene ontologies (biological process) for the 4,663 non-redundant transmembrane-proteins predicted. The figures indicate the number of proteins contained in a given annotation group.

References

    1. Agata K, Tanaka T, Kobayashi C, Kato K, Saitoh Y. Intercalary regeneration in planarians. Dev Dyn. 2003;226(2):308–316. doi: 10.1002/dvdy.10249. - DOI - PubMed
    1. Newmark PA, Sánchez Alvarado A. Not your father's planarian: a classic model enters the era of functional genomics. Nat Rev Genet. 2002;3(3):210–219. doi: 10.1038/nrg759. - DOI - PubMed
    1. Reddien PW, Sánchez-Alvarado A. Fundamentals of planarian regeneration. Annu Rev Cell Dev Biol. 2004;20:725–757. doi: 10.1146/annurev.cellbio.20.010403.095114. - DOI - PubMed
    1. Saló E. The power of regeneration and the stem-cell kingdom: freshwater planarians (Platyhelminthes) Bioessays. 2006;28(5):546–559. - PubMed
    1. Baguñà J, Saló E, Auladell C. Regeneration and pattern formation in planarians. III. Evidence that neoblasts are totipotent stem cells and the source of blastema cells. Development. 1989;107:77–86.

Publication types

MeSH terms

LinkOut - more resources