. 2011 Feb;105(2):142-8.
doi: 10.1016/j.jinorgbio.2010.10.010. Epub 2010 Oct 29.

Toxicity of depleted uranium complexes is independent of p53 activity

Affiliations

Toxicity of depleted uranium complexes is independent of p53 activity

Ellie Heintze et al. J Inorg Biochem. 2011 Feb.

Abstract

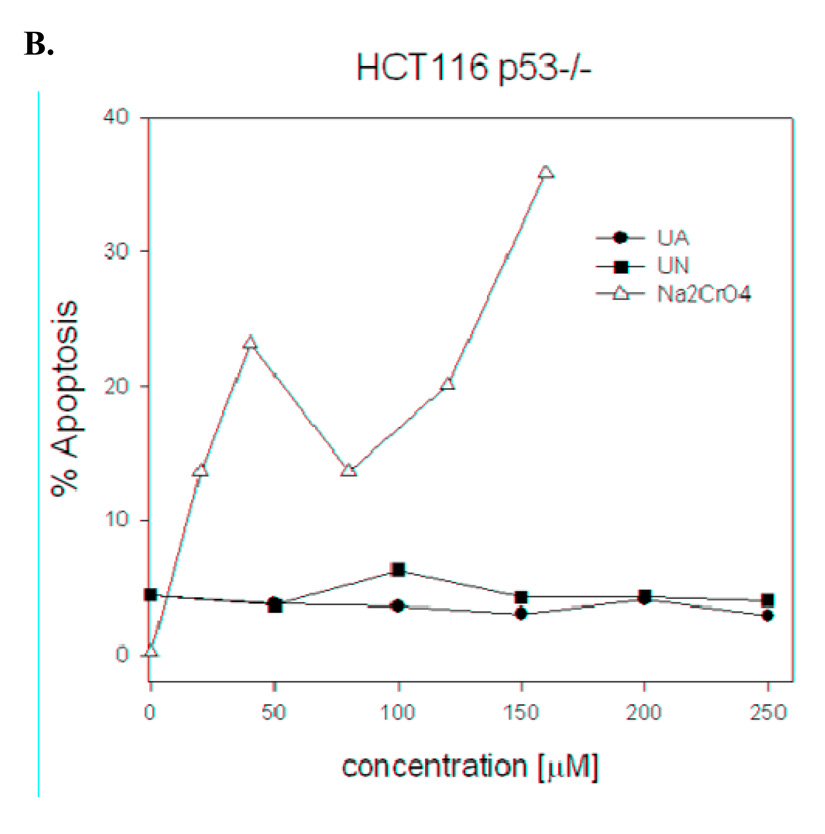
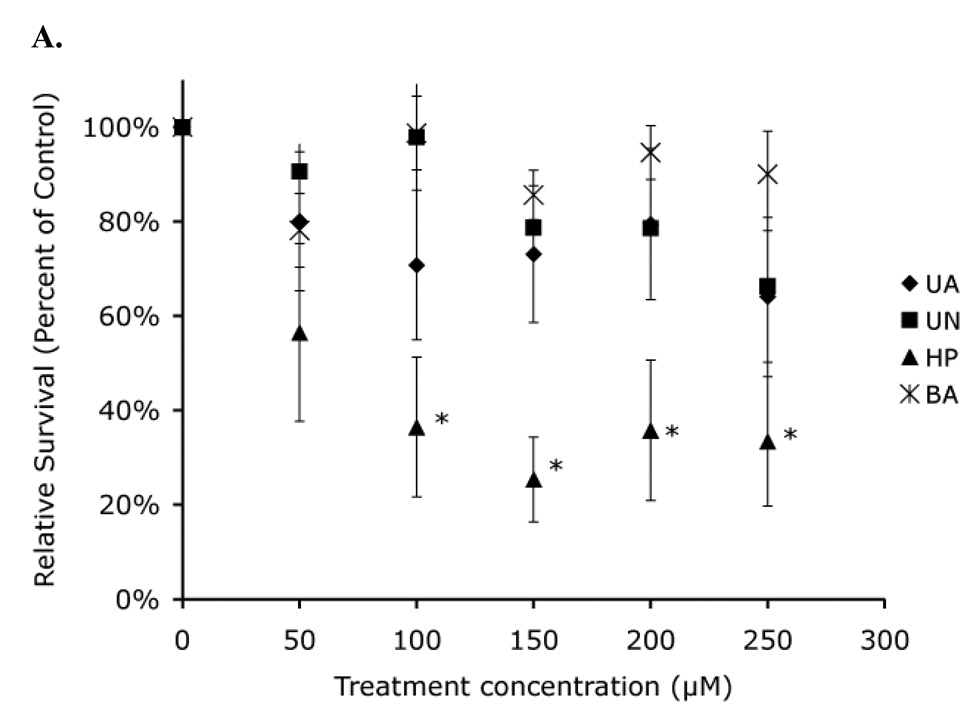
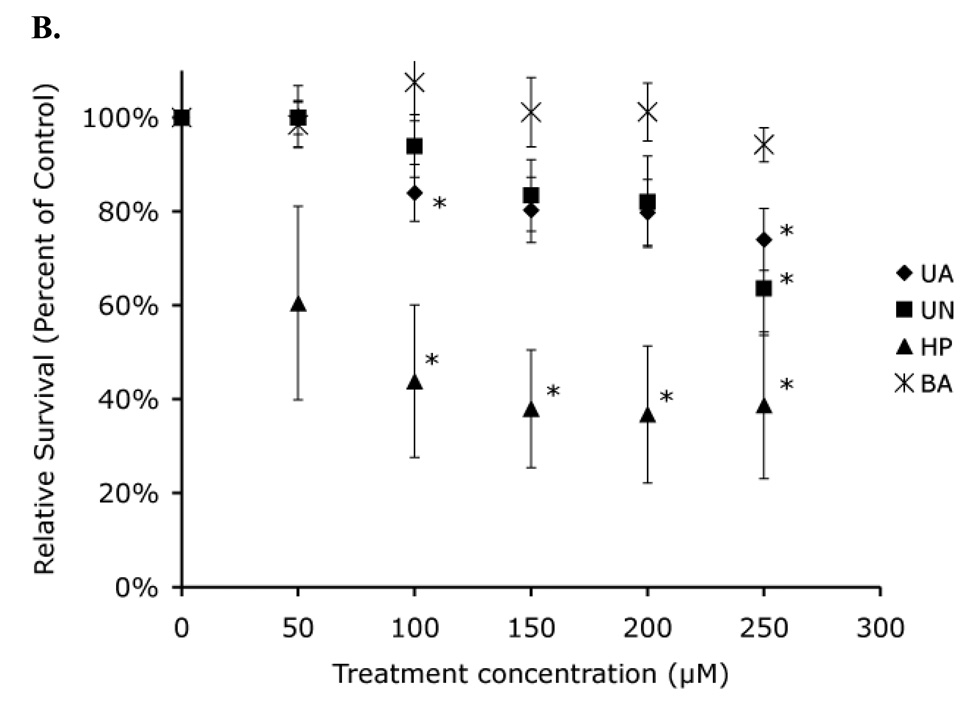
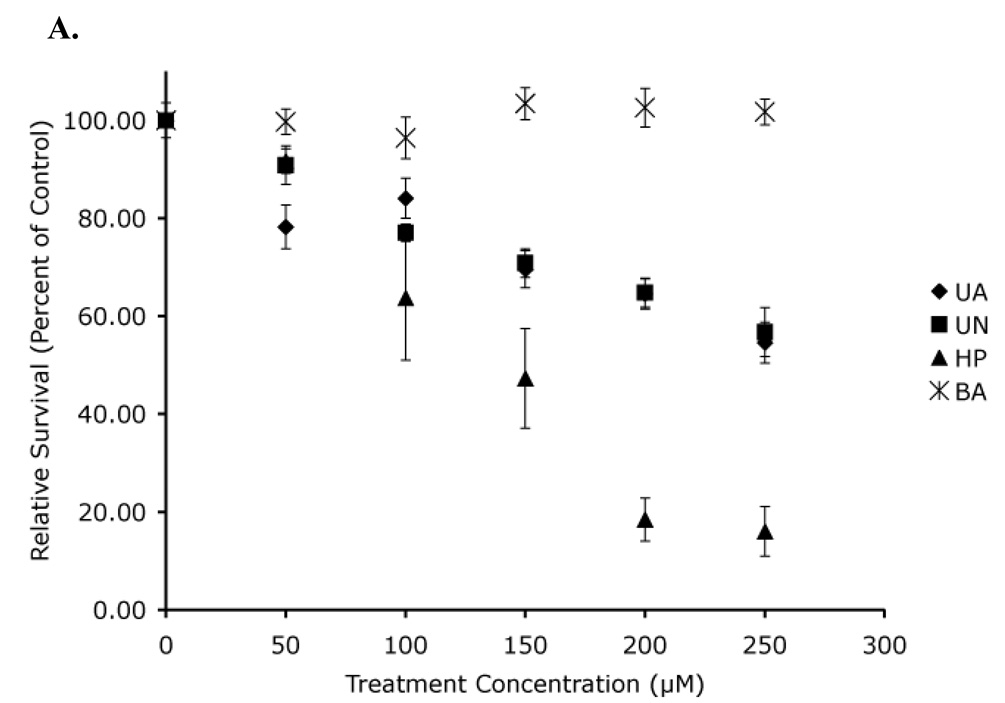
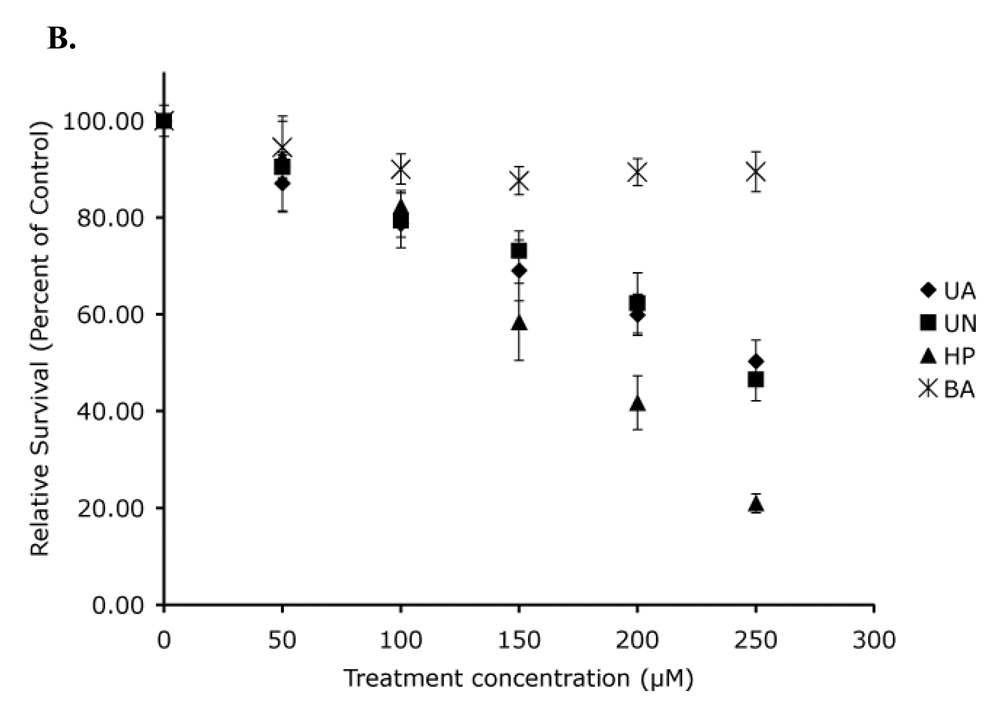
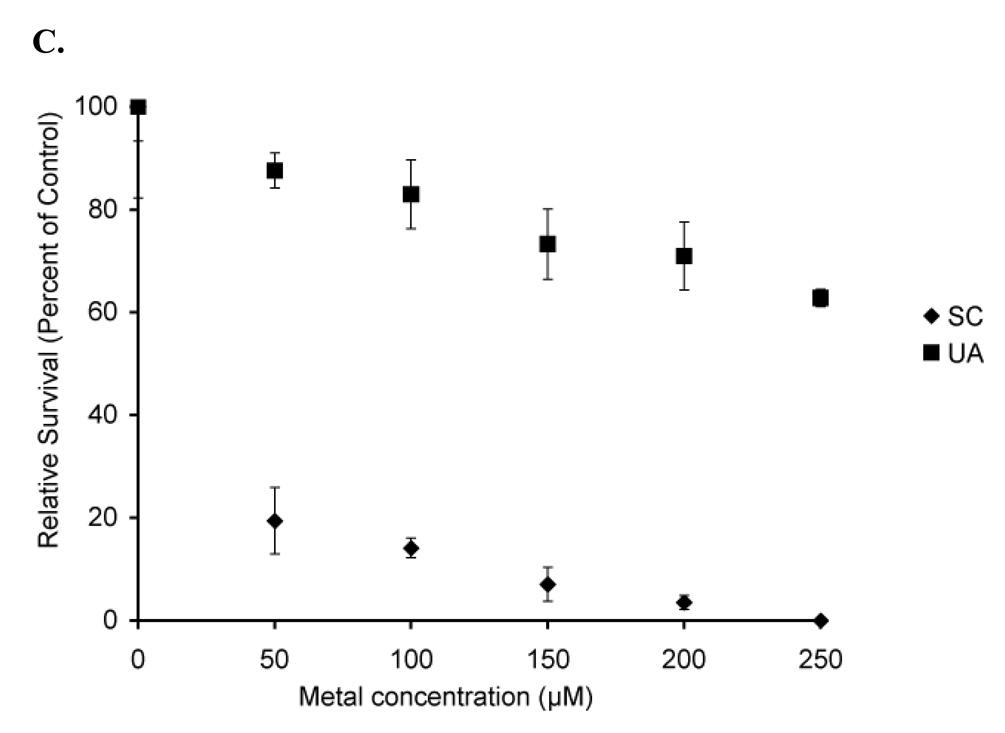
The p53 tumor suppressor protein is one of the key checkpoints in cellular response to a variety of stress mechanisms, including exposure to various toxic metal complexes. Previous studies have demonstrated that arsenic and chromium complexes are able to activate p53, but there is a dearth of data investigating whether uranium complexes exhibit similar effects. The use of depleted uranium (DU) has increased in recent years, raising concern about DU's potential carcinogenic effects. Previous studies have shown that uranyl acetate and uranyl nitrate are capable of inducing DNA strand breaks and potentially of inducing oxidative stress through free radical generation, two potential mechanisms for activation of p53. Based on these studies, we hypothesized that either uranyl acetate or uranyl nitrate could act as an activator of p53. We tested this hypothesis using a combination of cytotoxicity assays, p53 activity assays, western blotting and flow cytometry. All of our results demonstrate that there is not a p53-mediated response to either uranyl acetate or uranyl nitrate, demonstrating that any cellular response to uranium exposure likely occurs in a p53-independent fashion under the conditions studied.


Figures

Figure 1
Figure 1. Exposure to uranium does not cause cell cycle arrest regardless of p53 status
Hct116 (p53 +/+) (A) or Hct116 (p53 −/−) (B) cells were grown to 85% confluence and then exposed to either uranium acetate (UA) or uranium nitrate (UN). The cells were incubated with the uranium compounds for 24 h before harvesting and analyzing by flow cytometry. The graph depicts the fraction of cells in G1 at each of the concentrations and each point represents the average of 4500 events.
Figure 2
Figure 2. Exposure to uranium does not cause apoptosis regardless of p53 status
Hct116 (p53 +/+) (A) or Hct116 (p53 −/−) (B) cells were grown to 85% confluence and then exposed to either uranium acetate (UA) or uranium nitrate (UN). The cells were incubated with the uranium compounds for 24 h before harvesting and analyzing by flow cytometry. The graph depicts the fraction of viable cells and each point represents the average of 4500 events.
Figure 3
Figure 3. Hct116 p53(+/+) cells exhibit uptake of uranyl acetate
Hct116 (p53 +/+) cells were treated with uranyl acetate (UA) at the concentrations indicated for 48 h. Equivalent cell numbers were collected, lysed and treated with nitric acid to release internalized uranium. Cells treated for 48 h with uranyl acetate exhibit significant uptake of uranium relative to control samples.
Figure 4
Figure 4. Western blotting exhibits no activation of p53
Hct116 (p53 +/+) cells were treated with uranyl acetate (UA) or uranyl nitrate (UN) at the concentrations indicated for 24 h. Total cell extracts were prepared and tested for total p53 (upper blot) and for phospho-P53 levels (lower blot). Extracts prepared from A1-5 cells that were exposed to 5Gy ionizing radiation are included as a positive control (IR, far right lane).
Figure 5
Figure 5. Uranyl nitrate and uranyl acetate do not induce p53 activity
A1-5 cells expressing bacterial luciferase under control of a p53 promoter were treated with uranyl acetate (UA), uranyl nitrate (UN) and sodium chromate (SC). Sodium chromate exposure induced increased p53 activity, as shown by the increased luciferase signal, while no significant increase in p53 activity is seen following UA or UN exposure. (*) Normalized relative luminescence units/million cell signal were significantly different from 0 µM normalized relative luminescence units/million cells signal (p < 0.05). Data represents mean ± SEM for n = 3–7 experiments.
Figure 6
Figure 6. Acute toxicity demonstrates no significant difference in toxicity in the absence of p53
Hct116 (p53 +/+) cells (A) and Hct116 (p53 −/−) cells (B) were treated with uranyl acetate (UA), uranyl nitrate (UN), along with hydrogen peroxide (HP), and boric acid (BA) as positive and negative controls respectively. (*) Percent survival values were significantly different from survival of cells treated with BA (p < 0.05). Data represents mean ± SEM for n = 4–5 experiments.
Figure 7
Figure 7. Clonogenics demonstrates no significant difference in toxicity in the absence of p53
Hct116 (p53 +/+) cells (A) and Hct116 (p53 −/−) cells (B) were treated with uranyl acetate (UA), uranyl nitrate (UN), along with hydrogen peroxide (HP), and boric acid (BA) as positive and negative controls respectively. While both uranyl acetate and uranyl nitrate were toxic to Hct116 cells, there is no statistical difference between toxicity in cells expressing p53 and cells not expressing p53. A1-5 cells (C) treated with sodium chromate show significant toxicity relative to uranyl acetate. Data represents mean ± SEM for n = 3–5 experiments.

Similar articles

Cited by

References

    1. La Touche YD, Willis DL, Dawydiak OI. Health. Phys. 1987;53:147–162. - PubMed
    1. Domingo JL. Reprod. Toxicol. 2001;15:603–609. - PubMed
    1. Craft E, Abu-Qare A, Flaherty M, Garofolo M, Rincavage H, Abou-Donia M. J Toxicol. Environ. Health. B Crit. Rev. 2004;7:297–317. - PubMed
    1. Yazzie M, Gamble SL, Civitello ER, Stearns DM. Chem. Res. Toxicol. 2003;16:524–530. - PubMed
    1. Miller AC, Stewart M, Brooks K, Shi L, Page N. J. Inorg. Biochem. 2002;91:246–252. - PubMed

Publication types