. 2011 Jan 5;13(1):92-104.
doi: 10.1016/j.cmet.2010.12.010.

Enteric neurons and systemic signals couple nutritional and reproductive status with intestinal homeostasis

Affiliations

Enteric neurons and systemic signals couple nutritional and reproductive status with intestinal homeostasis

Paola Cognigni et al. Cell Metab. .

Erratum in

  • Cell Metab. 2012 Jan 4;15(1):128

Abstract

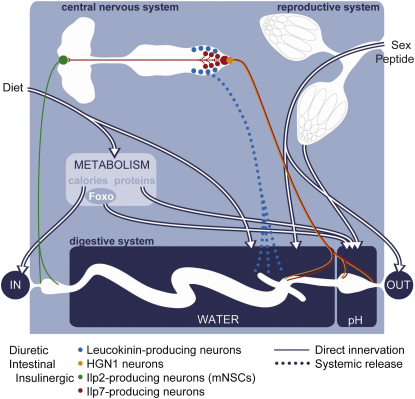
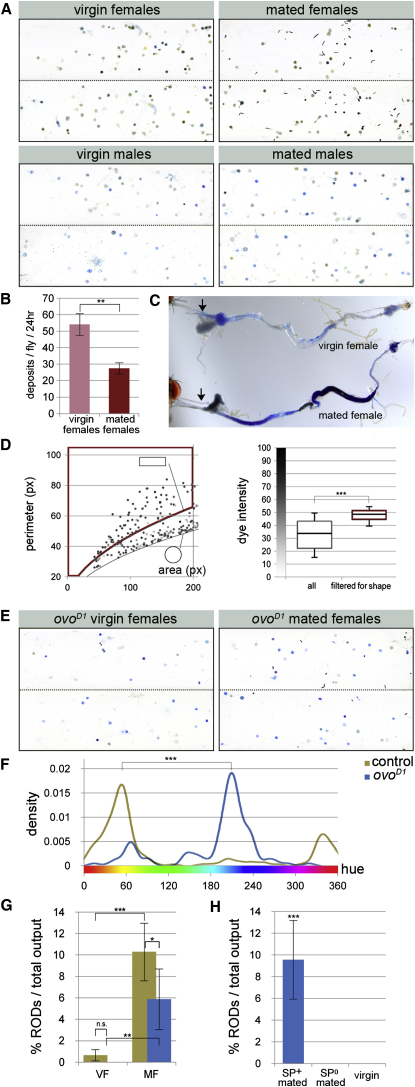
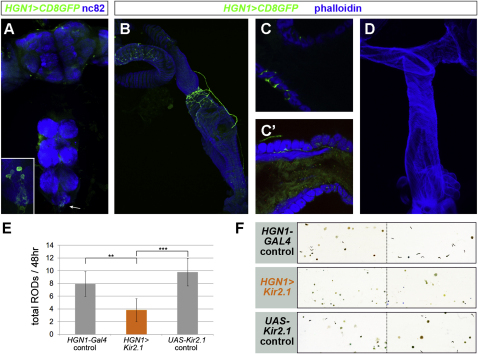
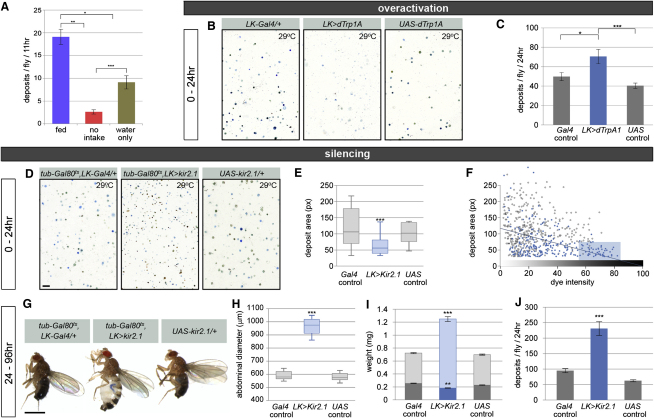
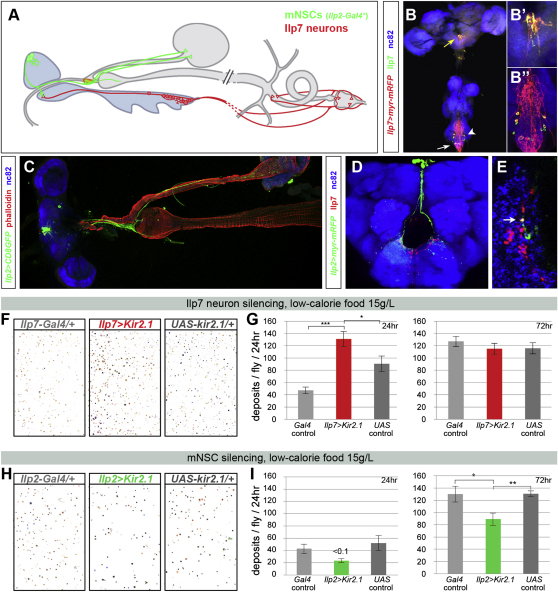
The gastrointestinal tract is emerging as a key regulator of appetite and metabolism, but daunting neuroanatomical complexity has hampered identification of the relevant signals. Invertebrate models could provide a simple and genetically amenable alternative, but their autonomic nervous system and its visceral functions remain largely unexplored. Here we develop a quantitative method based on defecation behavior to uncover a central role for the Drosophila intestine in the regulation of nutrient intake, fluid, and ion balance. We then identify a key homeostatic role for autonomic neurons and hormones, including a brain-gut circuit of insulin-producing neurons modulating appetite, a vasopressin-like system essential for fluid homeostasis, and enteric neurons mediating sex peptide-induced changes in intestinal physiology. These conserved mechanisms of visceral control, analogous to those found in the enteric nervous system and hypothalamic/pituitary axis, enable the study of autonomic control in a model organism that has proved instrumental in understanding sensory and motor systems.


Figures

None
Graphical abstract
Figure 1
Figure 1
Innervation of the Adult Intestine Smooth muscles are visualized with phalloidin (in blue). Anterior (oral) is to the left in all images except for (A) and (E) (where oral is toward the top) and (I). (A) Anterior midgut. Note the nerve fibers emanating from the corpus cardiacum/hypocerebral ganglion. (B) Whole digestive tract, showing three innervated portions. The anterior-most segment comprises the esophagus, esophageal valve, and anterior midgut (proventriculus, analogous to the human stomach, Wigglesworth, 1972) and is innervated both centrally and by the peripheral corpus cardiacum/hypocerebral ganglion. Following a midgut segment devoid of innervations, central fibers innervate the pyloric valve (which regulates the entry of midgut and renal tubule contents into the hindgut) and, following a short noninnervated ileum segment, the terminal portion of the intestine including the rectal valve, rectal ampulla, and rectum. This innervation pattern was confirmed with the panneuronal n-syb-Gal4 line (Figure S1) and eight other broadly expressed driver lines or antibodies (data not shown). (C and D) Innervation of the midgut/hindgut junction (pylorus, C) and the rectal ampulla (D). (E–G) Neurites projecting through contiguous circular smooth muscles (arrows) toward the epithelium (stained with anti-FasIII) of the crop duct (E) and the hindgut (F), and the underlying layer of longitudinal muscles in the rectum (G). (H) Sensory neurites (as visualized by expression of the dendritic marker Dscam17.1-GFP expressed from the peripheral neuron driver P0163-Gal4) in the esophagus. (I) A peripheral neuron innervating the rectal ampulla, as revealed by its expression of elav (antibody staining, red nucleus) and a membrane-tagged GFP expressed from elav-Gal4. (J) Sensory innervation of the rectal ampulla, as revealed by the ppk1.9-Gal4 reporter. See also Figure S1.
Figure 2
Figure 2
New Quantitative Methods to Assess Intestinal Functions (A–D) Strong fluorescence is apparent in intact (A) and dissected guts (B) and the excreta of Fluoropoo-fed flies, both on food (C, arrows) and on the clear walls of vials (D). The deposits from a mixed population have two distinct shapes (D, inset): round and oblong. (E–G) Shown are intestinal contents in BPB-fed intact flies (E) and dissected intestinal tracts (F). Like with Fluoropoo, no dye is apparent in the renal tubules (F, arrow) or fat body (F, arrowhead). (G) BPB-labeled deposits differ in their color and concentration. Round and oblong shapes are also apparent (G, inset). Oblong deposits are typically more concentrated. Scale bar, 1 mm. (H) Defined amounts of acid or base change the pH and color of BPB-supplemented food (top panels, insets). The color range of the resulting deposits shifts accordingly (top panels). Hue density distributions indicate that the majority of deposits cluster at specific hue points depending on the pH of the food. (I) Male flies fed drier food (standard food dried for 2 hr at 40°C) produce more concentrated deposits (increased average dye intensity, p < 0.0001, Mann-Whitney U test, n = 10 flies/set). This phenotype is rescued when flies fed on this dry food have additional access to water (p = 0.015 when compared to dry food, not significant when compared to standard food, Mann-Whitney U test, n = 10 flies/set). (J and K) Two pH indicators with a different pH range (see the Experimental Procedures for details) reveal pH changes along the intestinal tract under normal conditions (standard diet, pH 5.5). Hindgut contents are acidified just posterior to the renal tubules (J, purple to light orange). Further acidification occurs just prior to excretion in the rectum (K, blue to yellow). (L) Compensatory increase in feeding upon food dilution in the 135–15 g/L range, as measured by the CAFE assay (p < 0.001 135 g/L versus 45 g/L, p = 0.0095 45 g/L versus 15 g/L, p = 0.0018 135 g/L versus 15 g/L, Mann-Whitney U test, n = 14 flies/set, although only five flies were left in the 15 g/L group after 72 hr due to the high lethality caused by this low-calorie diet). (M) Differences in fecal output resulting from the same dilution series quantified using our assay (p < 0.001 135 g/L versus 45 g/L, p = 0.19 45 g/L versus 15 g/L, p < 0.0001 135 g/L versus 15 g/L, Mann-Whitney U test, n = 15 flies/set). No lethality was observed by 72 hr in the low-calorie 15 g/L diet. See also Figure S2, Table S1, and the Experimental Procedures for technical details and quantification protocols. Graphs show average ± standard error of the mean.
Figure 3
Figure 3
Dietary Regulation of Intestinal Acid-Base Balance (A) Regulation of fecal pH by diet composition. pH changes result from differential metabolism because all three diets were adjusted to the same initial pH (food color is shown in insets). The total concentration of all three diets was 45 g/L. (B) Hue density plots of excreta resulting from 100% sucrose (yellow plot), 40% yeast/60% sucrose (green), and 80% yeast/20% sucrose (blue) diets (p < 0.0001 for all three comparisons, two-sample Kolmogorov-Smirnov test). (C) Regulation of fecal pH by progressive dilution of a balanced diet with a constant 40% yeast, 60% sucrose ratio. (D) Hue density plots of excreta resulting from 90 g/L (blue), 45 g/L (green), and 15 g/L (yellow) diets (p < 0.0001 for all three comparisons, two-sample Kolmogorov-Smirnov test). (E) The acidification of excreta in sugar-fed flies occurs in the rectum. Note the change from blue to orange/red immediately posterior to the rectal valve (arrow). By contrast, intestinal contents remain basic in the hindgut of flies that have been fed a high fat/protein diet. (F) In foxo mutants, the shift to a more acidic pH triggered by a low-calorie diet is partly impaired, unlike that of control (w1118) flies. The hue density plot of foxo mutants does not peak at the red/orange hues indicative of acidic excreta (p < 0.0001, two-sample Kolmogorov-Smirnov test). The pH of their excreta and intestinal morphology was indistinguishable from that of control flies in fully fed conditions (Figures S3B–S3I and data not shown). In the next 48 hr, foxo mutants do shift to a more acidic pH fully, but this is accompanied by very high lethality (data not shown). The same results were obtained with a different foxo mutant combination (foxow24/foxo21, data not shown). (G) The effect of a sugar-only diet on acid-base balance is not affected in foxo mutants. The hue density plots of both controls and foxo mutants peak at red/orange hues. See also Figure S3.
Figure 4
Figure 4
Effects of Reproduction on Intestinal Physiology (A) Shown is representative fecal output of virgin or mated males and females. Although each subpanel consists of excreta of three to six flies, quantitative analyses were conducted on larger groups of flies (n = 9–12 flies, see Figure S4 for details). (B) The defecation rate of wild-type mated females is lower than that of virgin females (p = 0.007, Mann-Whitney U test, n = 10 flies/set). (C) The intestinal contents of mated females are more concentrated than those of virgin females. Concentration is already apparent in the crop and anterior midgut (arrows), suggesting a change in intestinal fluid retention. (D) Oblong deposits are very concentrated excreta. Left graph shows the distribution of deposits by area and perimeter in relation to circular shapes (lower black line, p = 2π√(a/π)) and an arbitrarily defined oblong shape (a 3 × 1 rectangle, upper black line, p = 8√[a/3]); dye intensity is represented in grayscale for each deposit. The subpopulation of noncircular deposits (p ≥ 8√[a/3] and area ≤ 200 px, boxed in red) is significantly darker than the population as a whole (right graph, p < 0.0001, Mann-Whitney U test, n = 12 flies). (E) Shown are fecal outputs of ovoD1 virgin and mated females, which lack functional ovaries. (F) The majority of excreta in ovoD1 virgin females are blue (basic). This contrasts with the wild-type profile of control OreR virgin females, which peaks around more acidic orange/green hues (p < 0.0001, two-sample Kolmogorov-Smirnov test). (G) Mating increases the relative frequency of concentrated RODs in both w1118 controls (brown bars) and ovoD1 females (blue bars, p < 0.001 and p = 0.009, respectively, Mann-Whitney U test, n = 9–10 flies/set). VF, virgin females; MF, mated females. (H) ovoD1 females do not produce RODs when they are mated to sex peptide null (SP0/SPΔ130) males (p < 0.001 when compared to ovoD1 females mated to control SP+/SPΔ130 males, Mann-Whitney U test and Fisher's combined probability test, n = 10–13 flies/set, two different experiments). See also Figures S4 and S5. Graphs show average ± standard error of the mean.
Figure 5
Figure 5
Enteric Neurons Required for the Sex Peptide-Induced Changes in Intestinal Physiology (A) HGN1-Gal4 expression in the central nervous system. Note the cell bodies in the posterior tip of the ventral ganglion (arrow and inset), with axons exiting in the posterior nerve toward the hindgut. nc82 highlights the brain neuropil. (B) Innervation of the anterior hindgut, rectal valve, ampulla, and rectum by HGN1 axons. Muscles are labeled in blue with phalloidin. (C and C′) HGN1 neurites project through contiguous circular muscles toward the hindgut epithelium in the rectal valve (C), and toward the underlying layer of longitudinal muscle in the rectum (C′). (D) HGN1 axons do not innervate the female reproductive system. (E) Reduced ROD production in mated females following HGN1 neuron inactivation (p = 0.005 against Gal4 control and p < 0.001 against UAS control, Mann-Whitney U test, n = 11–19 flies/set). (F) Representative fecal profiles of mated females with genetically inactivated HGN1 neurons and relevant controls. See the Supplemental Experimental Procedures for full genotypes. Graphs show average ± standard error of the mean.
Figure 6
Figure 6
Central Diuretic Neurons Regulate Fluid Homeostasis (A) Water availability modulates a starvation-induced reduction in defecation rate. Both nutrient and nutrient/water deprivation lead to a reduction in defecation rate when compared to fed flies (p = 0.015 and p = 0.001, respectively, Student's t test, n = 8 flies/set), but the total number of excreta over a period of 11 hr is much smaller in the absence of nutrients and water than when water is available (p < 0.001, Student's t test, n = 8 flies/set). (B) Compared to controls, flies in which LK neurons have been overactivated for 24 hr produce lighter deposits (many of which are hardly visible). (C) Their defecation rate is higher than that of controls (p = 0.021 against Gal4 control and p < 0.001 against UAS control, Student's t test, n = 17–20 flies/set). (D) Adult-specific inactivation of LK neurons results in smaller, more concentrated deposits than those excreted by wild-type controls (left and right panels). This phenotype is apparent after only 24 hr. The scale bar corresponds to 1 mm and applies to all three images. (E) Quantification of deposit size. Flies with inactive LK neurons excrete smaller deposits (p < 0.0001, Mann-Whitney U test). (F) LK neuron inactivation leads to the production of small, dark deposits. Size is inversely correlated to dye intensity in individual deposits excreted by LK > Kir2.1 flies (blue trend line, p < 0.0001, linear model fit, displaying least-squares line) but not in either of the control groups (p = 0.19 for Gal4 control, 0.17 for UAS control). Note the subpopulation of small and very dark deposits (shaded box) which is produced almost exclusively by LK > Kir2.1 flies. (G) A longer period of LK neuron inactivation (4 days) leads to bloated flies. The scale bar corresponds to 1 mm and applies to all three images. (H) The abdominal diameter of these flies is much larger than that of control flies (p < 0.0001, Mann-Whitney U test, n = 24–30 flies/set). (I) Their average weight is much larger than that of the two controls (p < 0.001, Student's t test, n ≥ 24 flies/set). The weight difference is caused by fluid retention because the dry weights of all three genotypes, represented by the dark portions of all three bars, are comparable. In fact, the dry weight of LK-silenced flies is marginally lower (p = 0.001 or lower, Student's t test). (J) The defecation rate of flies in which LK neurons have been inactivated for 4 days is higher than that of control flies (p < 0.0001, Mann-Whitney U test, n = 10 flies/set). See the Supplemental Experimental Procedures for full genotypes. See also Figure S6 and Movie S1. Graphs show average ± standard error of the mean.
Figure 7
Figure 7
Differential Regulation of the Homeostatic Response to Nutrient Scarcity by a Brain-Gut Circuit of Insulin-Producing Neurons (A) Shown is connectivity of the two small subsets of central neurons expressing insulin-like peptides: the mNSCs, with cell bodies located in the protocerebrum, and Ilp7 neurons in the ventral ganglion. Cell bodies are depicted as circles. Dendritic endings are shown as branches, whereas axonal terminals are shown as empty triangles. (B–B″) Shown are Ilp7 neurons colabeled with an anti-Ilp7 antibody and a membrane-tagged UAS-myr-mRFP reporter. Two axonal fibers emanating from Ilp7 cell bodies in the ventral ganglion terminate in the subesophageal ganglion, as indicated by the abundance of vesicles positive for Ilp7 (B′). Note the profuse dendritic arborizations in the ventral ganglion (B″), which are relatively devoid of Ilp7 peptide (compare the strong green signal of B′ to B″). nc82 is used as a general neuropil marker in (B)–(E). (C) mNSC axons, labeled by their expression of a membrane-tagged reporter from Ilp2-Gal4, reach the ring gland, which in the adult is found at the junction between the stomach, esophagus, and crop duct. Additional nerves project along the crop duct and arborize on the crop muscles. (D) Dendrites emanating from the mNSCs (visualized by their expression of UAS-myr-mRFP from Ilp2-Gal4, displayed in green) reach the subesophageal ganglion where Ilp7 axons (labeled with anti-Ilp7 antibody and displayed in red) terminate. For the sake of consistency with other panels, the green and red channels have been inverted in (D) and (E). (E) Single, high-magnification optical slice showing one punctum coexpressing Ilp7, Ilp2 > myr-mRFP and the synaptic marker nc82, suggesting synaptic contact between Ilp7 axons and mNSC dendrites. (F) Increased fecal output of Ilp7 neuron-silenced flies relative to controls on a low-calorie diet for 48 hr. The shift to more orange hues occurs normally. (G) Time course analysis of defecation rate under dietary restriction. After 24 hr, only flies with genetically inactivated Ilp7 neurons have increased defecation rate (p < 0.0001 and p = 0.029, Mann-Whitney U test and Fisher's combined probability test of two experiments, n ≥ 28 flies/set. Graphs and statistics are displayed for one of the two experiments). After a longer period of nutrient deprivation (72 hr), there are no significant differences between the defecation rate of controls and Ilp7 neuron-silenced flies. We could not measure food intake directly using the CAFE assay due to the high lethality associated with this food dilution when supplied in liquid form, but we confirmed that the increased fecal output results from increased food intake, because it is not accompanied by reduced gut capacity (Figure S7A) or a decrease in the dye content of excreta (Figure 7F and Figure S7C). (H) Fecal outputs of control and mNSC-silenced flies fed a low-calorie diet for 48 hr. Inactivation of mNSC neurons was confined to the late third-instar stage onward using a late Gal4 driver to circumvent defects associated with reduced growth during development. Flies with genetically inactivated mNSCs excrete fewer deposits. The shift to more orange hues occurs normally. (I) Time course analysis of defecation rate following the nutritional challenge. After 24 hr, the defecation rate of mNSC-silenced flies tends to be lower than that of control flies (p < 0.001 and p = 0.23, Mann-Whitney U test and Fisher's combined probability test of two experiments, n ≥ 28 flies/set). After 72 hr, their defecation rate becomes significantly lower than that of controls (p < 0.0001 and p = 0.002, Mann-Whitney U test and Fisher's combined probability test of two experiments, n ≥ 28 flies/set). Graphs and statistics are displayed for one of the two experiments. As in the case of mNSC inactivation, intestinal capacity and dye content controls confirmed that these changes are reflective of food intake (Figures S7B, S7D, and 7H). See the Supplemental Experimental Procedures for full genotypes. See also Figure S7. Graphs show average ± standard error of the mean.

References

    1. Agoston M.K. Springer; London: 2005. Computer Graphics and Geometric Modeling: Implementation and Algorithms.
    1. Al-Anzi B., Armand E., Nagamei P., Olszewski M., Sapin V., Waters C., Zinn K., Wyman R.J., Benzer S. The leucokinin pathway and its neurons regulate meal size in Drosophila. Curr. Biol. 2010;20:969–978. - PMC - PubMed
    1. Arquier N., Geminard C., Bourouis M., Jarretou G., Honegger B., Paix A., Leopold P. Drosophila ALS regulates growth and metabolism through functional interaction with insulin-like peptides. Cell Metab. 2008;7:333–338. - PubMed
    1. Avery L., Thomas J.H. Feeding and defecation. In: Riddle D.L., Blumenthal T., Meyer B.J., Priess J.R., editors. C. elegans II. Cold Spring Harbor Laboratory Press; New York: 1997. - PubMed
    1. Barnes A.I., Wigby S., Boone J.M., Partridge L., Chapman T. Feeding, fecundity and lifespan in female Drosophila melanogaster. Proc. Biol. Sci. 2008;275:1675–1683. - PMC - PubMed

Publication types

MeSH terms