

A comparison of spatial and social clustering of cholera in Matlab, Bangladesh
- PMID: 21195655
- PMCID: PMC3056893
- DOI: 10.1016/j.healthplace.2010.12.004
A comparison of spatial and social clustering of cholera in Matlab, Bangladesh
Abstract
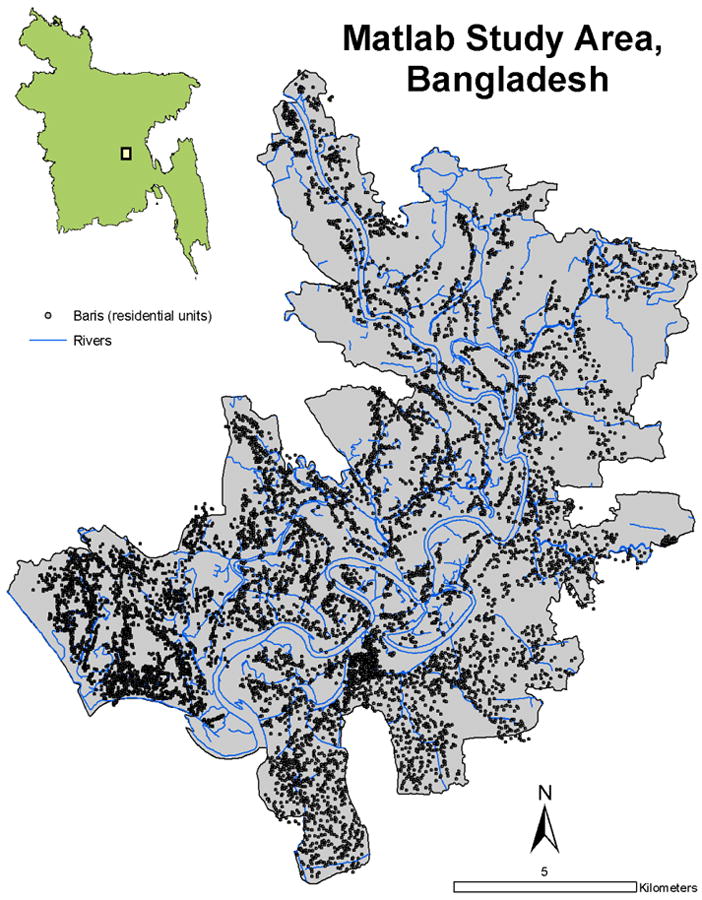
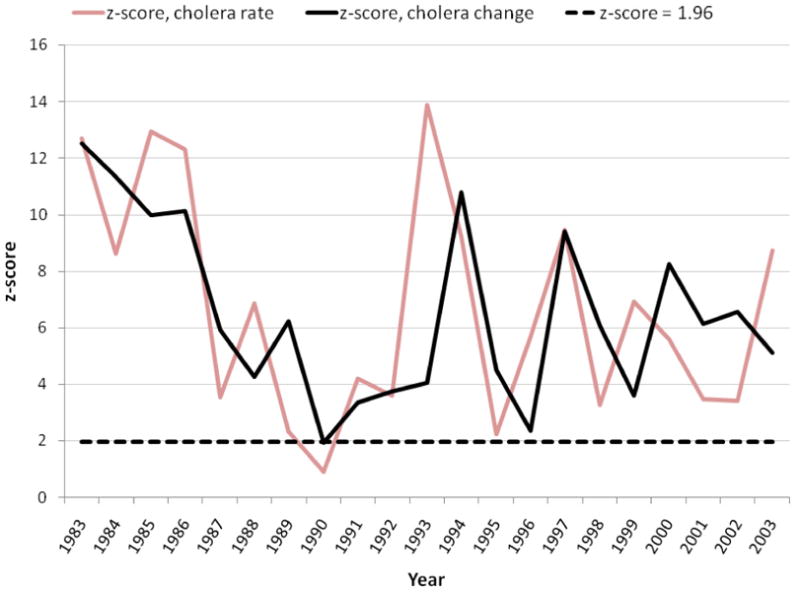
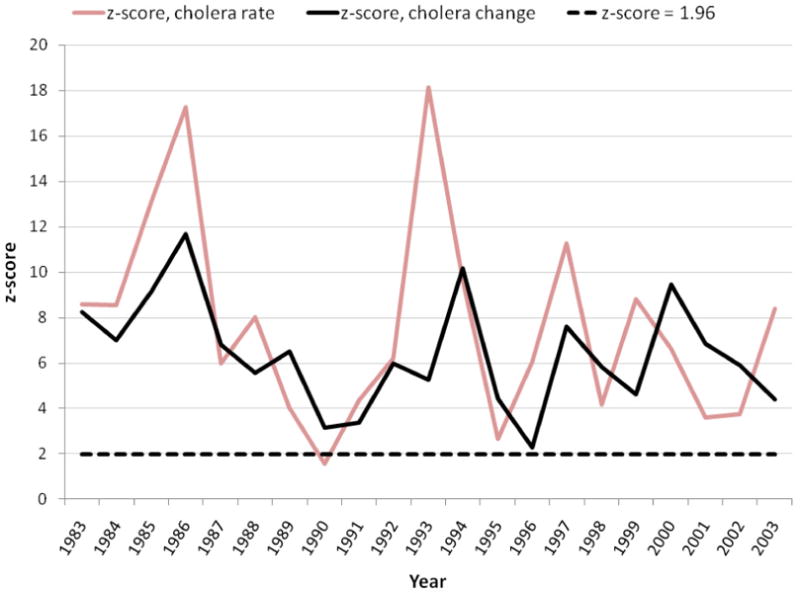
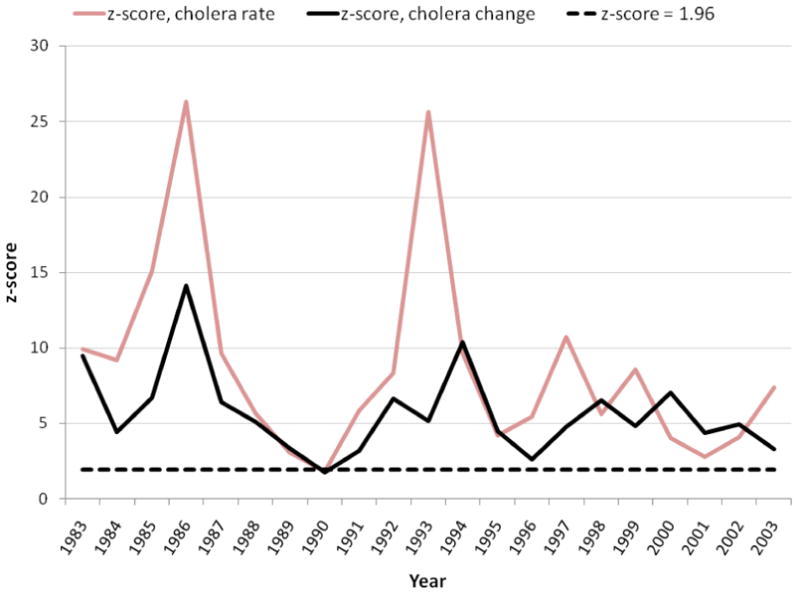
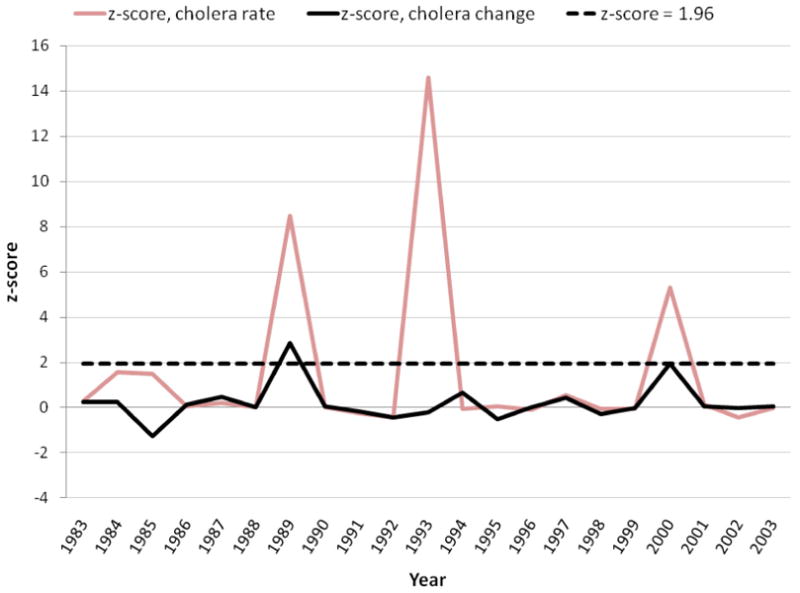
Infectious diseases often cluster spatially, but can also cluster socially because they are transmitted within social networks. This study compares spatial and social clustering of cholera in rural Bangladesh. Data include a spatially referenced longitudinal demographic database, which consists of approximately 200,000 people and laboratory-confirmed cholera cases from 1983 to 2003. Matrices are created of kinship ties between households using a complete network design and distance matrices are also created to model spatial relationships. Moran's I statistics are calculated to measure clustering within both social and spatial matrices. The results show that cholera always clusters in space and seldom within social networks. Cholera is transmitted mostly through the local environment rather than through person-to-person contact. Comparing spatial and social network analysis can help improve understanding of disease transmission.
Copyright © 2010 Elsevier Ltd. All rights reserved.
Figures
Similar articles
-
Integration of Spatial and Social Network Analysis in Disease Transmission Studies.Ann Assoc Am Geogr. 2012;105(5):1004-1015. doi: 10.1080/00045608.2012.671129. Ann Assoc Am Geogr. 2012. PMID: 24163443 Free PMC article.
-
The simultaneous effects of spatial and social networks on cholera transmission.Interdiscip Perspect Infect Dis. 2011;2011:604372. doi: 10.1155/2011/604372. Epub 2011 Dec 7. Interdiscip Perspect Infect Dis. 2011. PMID: 22187553 Free PMC article.
-
Spatial and population drivers of persistent cholera transmission in rural Bangladesh: Implications for vaccine and intervention targeting.Spat Spatiotemporal Epidemiol. 2018 Feb;24:1-9. doi: 10.1016/j.sste.2017.09.001. Epub 2017 Oct 16. Spat Spatiotemporal Epidemiol. 2018. PMID: 29413709 Free PMC article.
-
Mechanisms of cholera transmission via environment in India and Bangladesh: state of the science review.Rev Environ Health. 2023 Jan 16;39(2):313-329. doi: 10.1515/reveh-2022-0201. Print 2024 Jun 25. Rev Environ Health. 2023. PMID: 36639850 Review.
-
The impact of climate on the disease dynamics of cholera.Clin Microbiol Infect. 2009 Jan;15 Suppl 1:29-31. doi: 10.1111/j.1469-0691.2008.02686.x. Clin Microbiol Infect. 2009. PMID: 19220350 Review.
Cited by
-
Genotypic and Spatial Analysis of Mycobacterium tuberculosis Transmission in a High-Incidence Urban Setting.Clin Infect Dis. 2015 Sep 1;61(5):758-66. doi: 10.1093/cid/civ365. Epub 2015 May 5. Clin Infect Dis. 2015. PMID: 25948063 Free PMC article.
-
Seasonality of cholera in Kolkata and the influence of climate.BMC Infect Dis. 2023 Sep 2;23(1):572. doi: 10.1186/s12879-023-08532-1. BMC Infect Dis. 2023. PMID: 37660078 Free PMC article.
-
The role of vaccine coverage within social networks in cholera vaccine efficacy.PLoS One. 2011;6(7):e22971. doi: 10.1371/journal.pone.0022971. Epub 2011 Jul 29. PLoS One. 2011. PMID: 21829566 Free PMC article. Clinical Trial.
-
Risk factors for diarrhea hospitalization in Bangladesh, 2000-2008: a case-case study of cholera and shigellosis.BMC Infect Dis. 2014 Aug 15;14:440. doi: 10.1186/1471-2334-14-440. BMC Infect Dis. 2014. PMID: 25127553 Free PMC article.
-
Adding the spatial dimension to the social network analysis of an epidemic: investigation of the 2007 outbreak of equine influenza in Australia.Prev Vet Med. 2012 Sep 15;106(2):123-35. doi: 10.1016/j.prevetmed.2012.01.020. Epub 2012 Feb 23. Prev Vet Med. 2012. PMID: 22365721 Free PMC article.
References
-
- Ali M, Emch M, Donnay JP, Yunus M, Sack RB. Identifying environmental risk factors for endemic cholera: A raster GIS approach. Health & Place. 2002a;8(3):201–210. - PubMed
-
- Ali M, Emch M, Donnay JP, Yunus M, Sack RB. The spatial epidemiology of cholera in an endemic area of Bangladesh. Social Science & Medicine. 2002b;55(6):1015–1024. - PubMed
-
- Amin S. Family structure and change in rural Bangladesh. Population Studies. 1998;52:201–213.
-
- Amin S. The Poverty-Purdah trap in rural Bangladesh: Implications for women's roles in the family. Development and Change. 1997;28(2):213–233.
Publication types
MeSH terms
Grants and funding
LinkOut - more resources
Full Text Sources
Medical
