

Antemortem differential diagnosis of dementia pathology using structural MRI: Differential-STAND
- PMID: 21195775
- PMCID: PMC3039279
- DOI: 10.1016/j.neuroimage.2010.12.073
Antemortem differential diagnosis of dementia pathology using structural MRI: Differential-STAND
Abstract
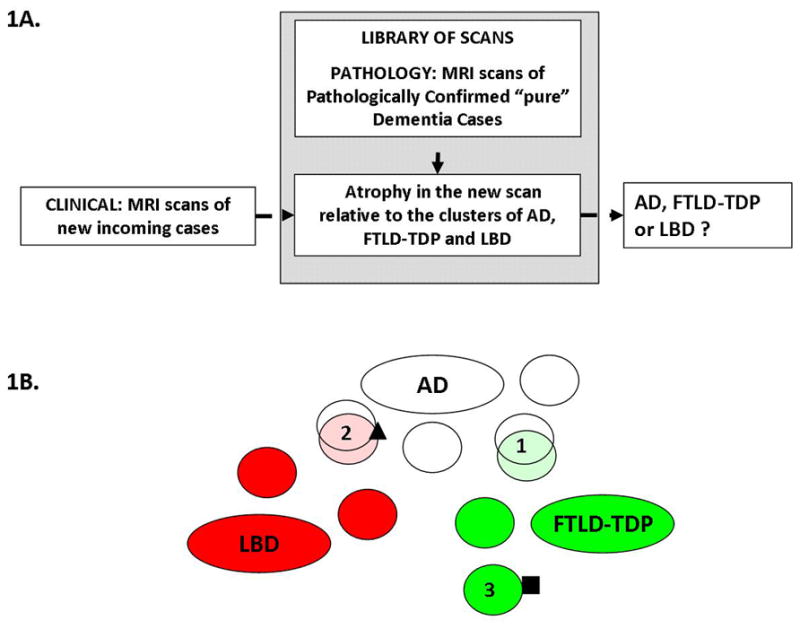
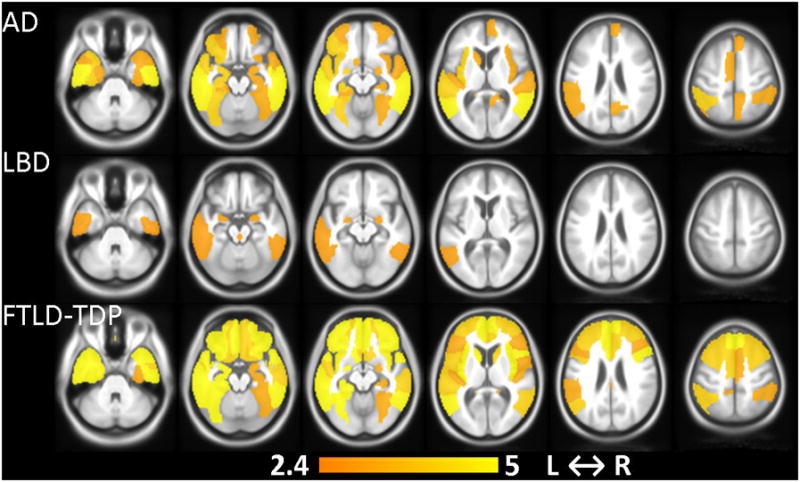
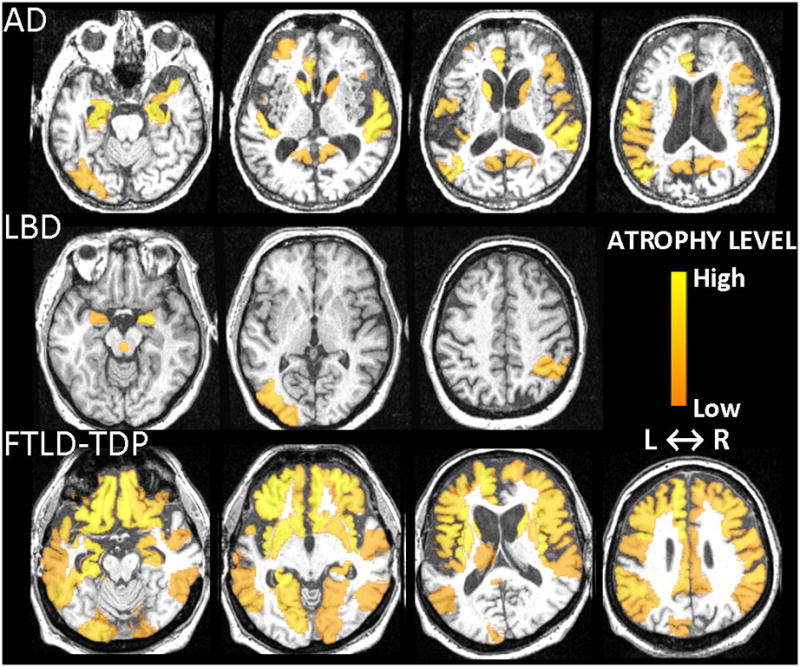
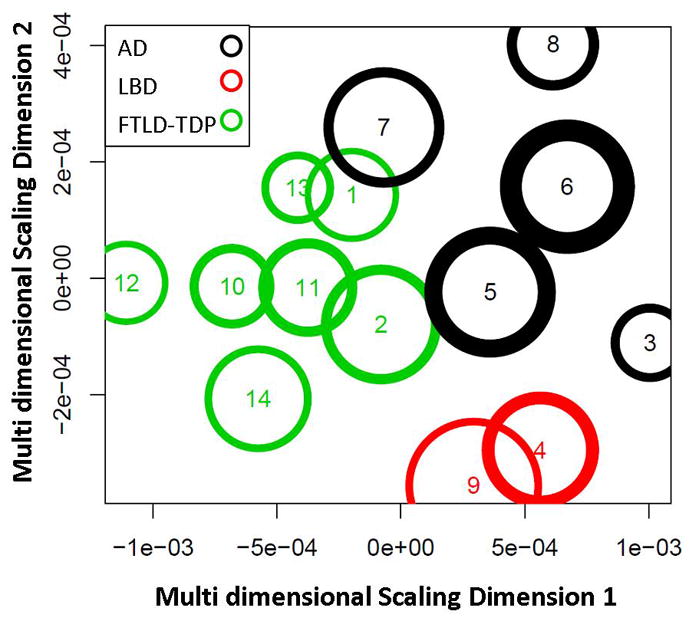
The common neurodegenerative pathologies underlying dementia are Alzheimer's disease (AD), Lewy body disease (LBD) and frontotemporal lobar degeneration (FTLD). Our aim was to identify patterns of atrophy unique to each of these diseases using antemortem structural MRI scans of pathologically confirmed dementia cases and build an MRI-based differential diagnosis system. Our approach of creating atrophy maps using structural MRI and applying them for classification of new incoming patients is labeled Differential-STAND (Differential Diagnosis Based on Structural Abnormality in Neurodegeneration). Pathologically confirmed subjects with a single dementing pathologic diagnosis who had an MRI at the time of clinical diagnosis of dementia were identified: 48 AD, 20 LBD, 47 FTLD-TDP (pathology-confirmed FTLD with TDP-43). Gray matter density in 91 regions-of-interest was measured in each subject and adjusted for head size and age using a database of 120 cognitively normal elderly. The atrophy patterns in each dementia type when compared to pathologically confirmed controls mirrored known disease-specific anatomic patterns: AD-temporoparietal association cortices and medial temporal lobe; FTLD-TDP-frontal and temporal lobes and LBD-bilateral amygdalae, dorsal midbrain and inferior temporal lobes. Differential-STAND based classification of each case was done based on a mixture model generated using bisecting k-means clustering of the information from the MRI scans. Leave-one-out classification showed reasonable performance compared to the autopsy gold standard and clinical diagnosis: AD (sensitivity: 90.7%; specificity: 84%), LBD (sensitivity: 78.6%; specificity: 98.8%) and FTLD-TDP (sensitivity: 84.4%; specificity: 93.8%). The proposed approach establishes a direct a priori relationship between specific topographic patterns on MRI and "gold standard" of pathology which can then be used to predict underlying dementia pathology in new incoming patients.
Copyright © 2010 Elsevier Inc. All rights reserved.
Figures
References
-
- Alexander GE, Moeller JR. Application of the scaled subprofile model to functional imaging in neuropsychiatric disorders: a principal component approach to modeling regional patterns of brain function in disease. Human Brain Mapping. 1994;2:79–94.
-
- Alladi S, Xuereb J, Bak T, Nestor P, Knibb J, Patterson K, Hodges JR. Focal cortical presentations of Alzheimer’s disease. Brain. 2007;130:2636–2645. - PubMed
-
- American Psychiatric Association. Diagnostic and Statistical Manual of Mental Disorders. 4. American Psychiatric Association; Washington DC: 1994. (DSM IV)
-
- Ashburner J, Friston KJ. Unified segmentation. Neuroimage. 2005;26:839–851. - PubMed
-
- Benarroch EE. Basic Neurosciences with clinical applications. Elsevier; Philadelphia: 2006.
Publication types
MeSH terms
Grants and funding
LinkOut - more resources
Full Text Sources
Medical
