

Incidence patterns and outcomes for hodgkin lymphoma patients in the United States
- PMID: 21197477
- PMCID: PMC3010617
- DOI: 10.1155/2011/725219
Incidence patterns and outcomes for hodgkin lymphoma patients in the United States
Abstract
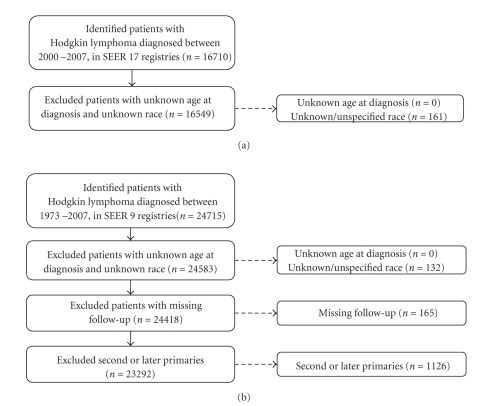
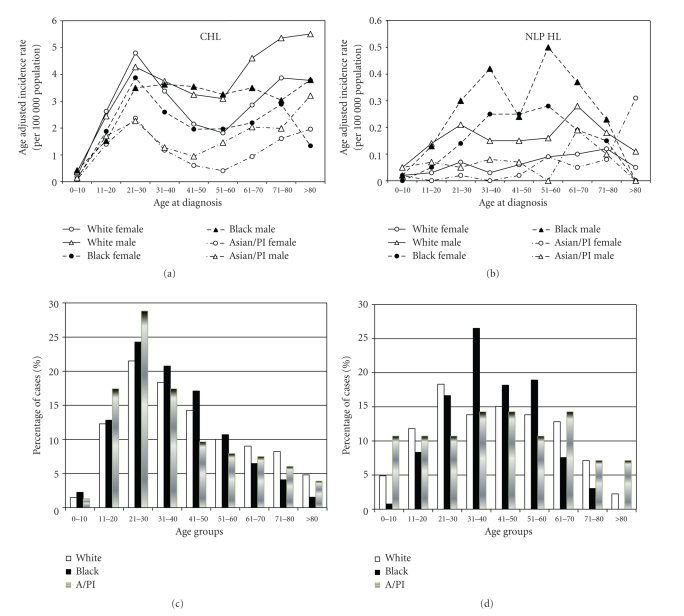
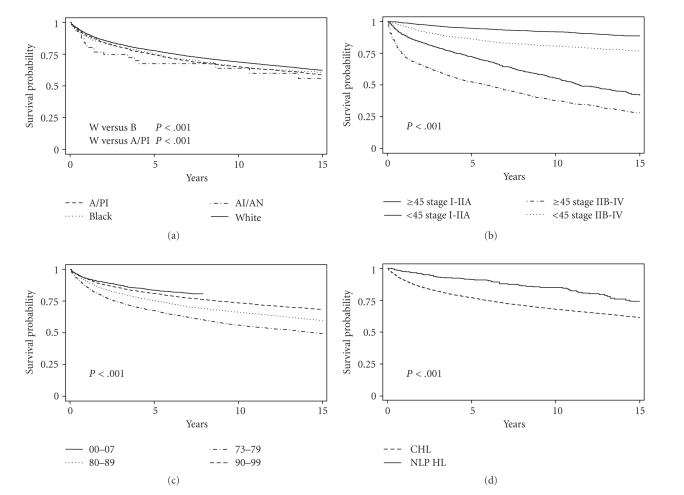
Hodgkin lymphoma (HL) demonstrates heterogenous histologic findings, clinical presentation, and outcomes. Using the United States Surveillance, Epidemiology, and End Results (SEER) data we examined relationships between patient characteristics, clinical features at diagnosis, and survival in HL patients. From 2000 to 2007, 16,710 cases were recorded in 17 SEER registries. Blacks and Asians had low incidence (black/white incidence rate ratio (IRR) 0.86, P < .01; Asian/white IRR 0.43, P < .01). The bimodal pattern of incidence was less prominent for black males. Asians and Blacks presented at a mean age of 38 years compared to 42 years for Whites (P < .001). Race was a predictor for survival with HR of 1.19 (95% CI 1.11-1.28) for Blacks. Age was the most important predictor of survival (HR for patients ≥45 years 5.08, 95% CI 4.86-5.31). These current patterns for presentation and outcomes of HL help to delineate key populations in order to explore risk factors for HL and strategies to improve treatment outcomes.
Figures
References
-
- Schnitzer B. Hodgkin lymphoma. Hematology/Oncology Clinics of North America. 2009;23(4):747–768. - PubMed
-
- Burke J. Hodgkin’s disease: histopathology and differential diagnosis. In: Knowles D, editor. Neoplastic Hematopathology. Baltimore, Md, USA: Williams and Wilkins; 1992. pp. 497–533.
-
- American Cancer Society. Cancer Facts & Figures 2010. http://www.cancer.org/acs/groups/content/@nho/documents/document/acspc-0....
-
- Devita VT, Jr., Serpick AA, Carbone PP. Combination chemotherapy in the treatment of advanced Hodgkin’s disease. Annals of Internal Medicine. 1970;73(6):881–895. - PubMed
-
- Brenner H, Gondos A, Pulte D. Ongoing improvement in long-term survival of patients with Hodgkin disease at all ages and recent catch-up of older patients. Blood. 2008;111(6):2977–2983. - PubMed
LinkOut - more resources
Full Text Sources
Other Literature Sources
