

Influenza A virus infection kinetics: quantitative data and models
- PMID: 21197654
- PMCID: PMC3256983
- DOI: 10.1002/wsbm.129
Influenza A virus infection kinetics: quantitative data and models
Abstract
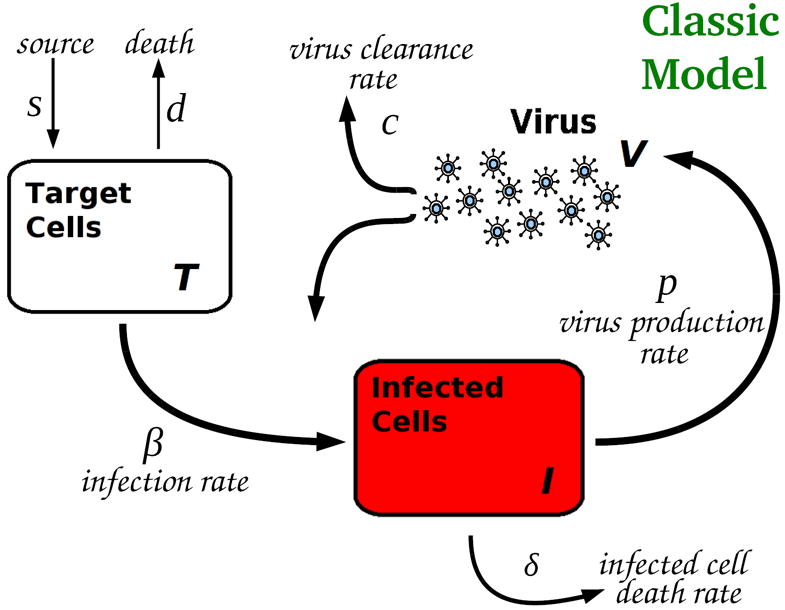
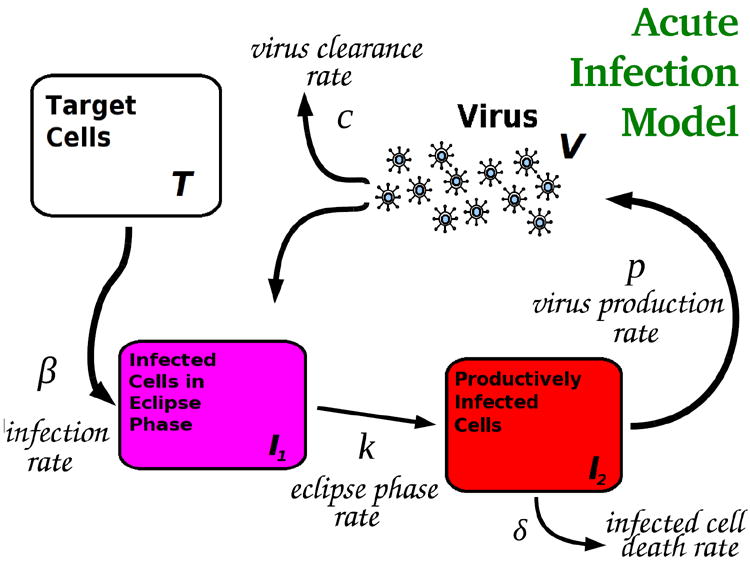
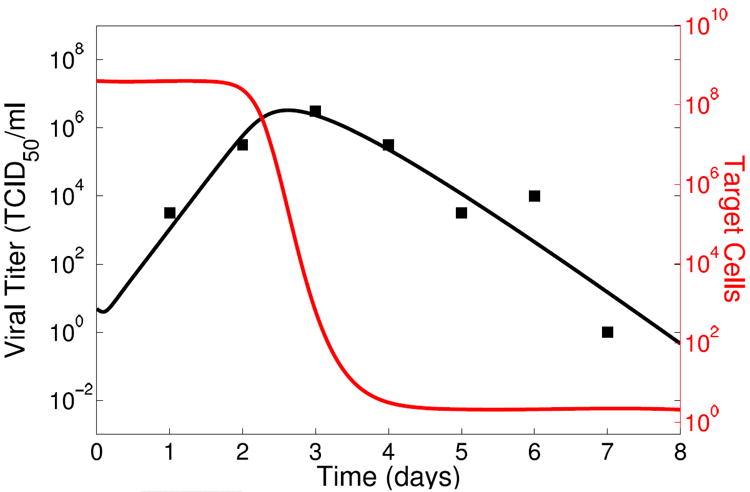
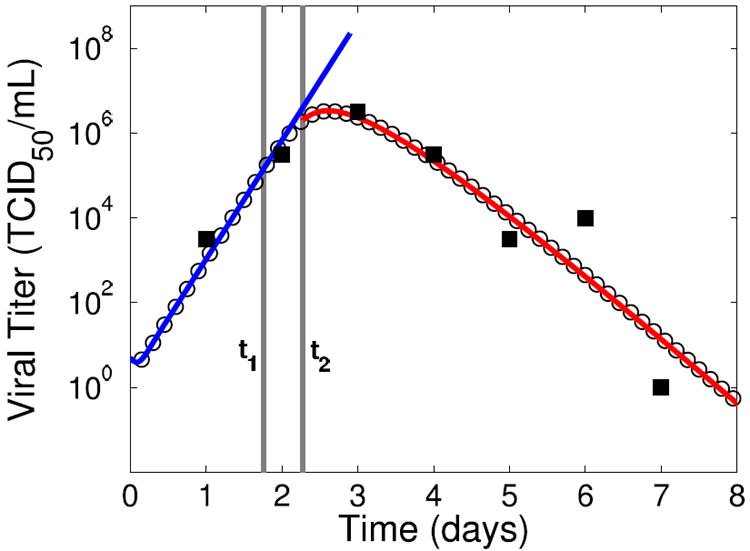
Influenza A virus is an important respiratory pathogen that poses a considerable threat to public health each year during seasonal epidemics and even more so when a pandemic strain emerges. Understanding the mechanisms involved in controlling an influenza infection within a host is important and could result in new and effective treatment strategies. Kinetic models of influenza viral growth and decay can summarize data and evaluate the biological parameters governing interactions between the virus and the host. Here we discuss recent viral kinetic models for influenza. We show how these models have been used to provide insight into influenza pathogenesis and treatment, and we highlight the challenges of viral kinetic analysis, including accurate model formulation, estimation of important parameters, and the collection of detailed data sets that measure multiple variables simultaneously. WIREs Syst Biol Med 2011 3 429-445 DOI: 10.1002/wsbm.129
Copyright © 2010 John Wiley & Sons, Inc.
Figures
Similar articles
-
Influenza Virus Infection, Interferon Response, Viral Counter-Response, and Apoptosis.Viruses. 2017 Aug 12;9(8):223. doi: 10.3390/v9080223. Viruses. 2017. PMID: 28805681 Free PMC article. Review.
-
The Mechanisms for Within-Host Influenza Virus Control Affect Model-Based Assessment and Prediction of Antiviral Treatment.Viruses. 2017 Jul 26;9(8):197. doi: 10.3390/v9080197. Viruses. 2017. PMID: 28933757 Free PMC article.
-
Targeting the Ubiquitin Proteasome System to Combat Influenza A Virus: Hijacking the Cleanup Crew.Rev Med Virol. 2024 Nov;34(6):e70005. doi: 10.1002/rmv.70005. Rev Med Virol. 2024. PMID: 39516190 Review.
-
Influenza A virus infection in zebrafish recapitulates mammalian infection and sensitivity to anti-influenza drug treatment.Dis Model Mech. 2014 Nov;7(11):1227-37. doi: 10.1242/dmm.014746. Epub 2014 Sep 4. Dis Model Mech. 2014. PMID: 25190709 Free PMC article.
-
Combinatory Treatment with Oseltamivir and Itraconazole Targeting Both Virus and Host Factors in Influenza A Virus Infection.Viruses. 2020 Jun 29;12(7):703. doi: 10.3390/v12070703. Viruses. 2020. PMID: 32610711 Free PMC article.
Cited by
-
Immunopathogenesis of SARS-CoV-2-induced pneumonia: lessons from influenza virus infection.Inflamm Regen. 2020 Oct 12;40:39. doi: 10.1186/s41232-020-00148-1. eCollection 2020. Inflamm Regen. 2020. PMID: 33062077 Free PMC article. Review.
-
Model-based simulation and prediction of an antiviral strategy against influenza A infection.PLoS One. 2013 Jul 9;8(7):e68235. doi: 10.1371/journal.pone.0068235. Print 2013. PLoS One. 2013. PMID: 23874556 Free PMC article.
-
Ebola viral dynamics in nonhuman primates provides insights into virus immuno-pathogenesis and antiviral strategies.Nat Commun. 2018 Oct 1;9(1):4013. doi: 10.1038/s41467-018-06215-z. Nat Commun. 2018. PMID: 30275474 Free PMC article.
-
Modeling Influenza Virus Infection: A Roadmap for Influenza Research.Viruses. 2015 Oct 12;7(10):5274-304. doi: 10.3390/v7102875. Viruses. 2015. PMID: 26473911 Free PMC article. Review.
-
Personalized Virus Load Curves for Acute Viral Infections.Viruses. 2021 Sep 13;13(9):1815. doi: 10.3390/v13091815. Viruses. 2021. PMID: 34578396 Free PMC article.
References
-
- Aoki F, Macleod M, Paggiaro P, Carewicz O, El Sawy A, Wat C, Griffiths M, Waalberg E, Ward P. Early administration of oral oseltamivir increases the benefits of influenza treatment. J Antimicrob Chemother. 2003;51(1):123–129. - PubMed
-
- Barroso L, Treanor J, Gubareva L, Hayden F. Efficacy and tolerability of the oral neuraminidase inhibitor peramivir in experimental human influenza: randomized, controlled trials for prophylaxis and treatment. Antivir Ther. 2005;10(8):901–910. - PubMed
-
- Beauchemin C, Samuel J, Tuszynski J. A simple cellular automaton model for influenza A viral infections. J Theor Biol. 2005;232(2):223–234. - PubMed
Publication types
MeSH terms
Substances
Grants and funding
LinkOut - more resources
Full Text Sources
Other Literature Sources
Medical
