Comparative Study
. 2011 Feb;44(1):33-48.
doi: 10.1111/j.1365-2184.2010.00715.x.

Fibrin acts as biomimetic niche inducing both differentiation and stem cell marker expression of early human endothelial progenitor cells

Affiliations
Comparative Study

Fibrin acts as biomimetic niche inducing both differentiation and stem cell marker expression of early human endothelial progenitor cells

M C Barsotti et al. Cell Prolif. 2011 Feb.

Abstract

Objectives: Transplantation of endothelial progenitor cells (EPCs) is a promising approach for revascularization of tissue. We have used a natural and biocompatible biopolymer, fibrin, to induce cell population growth, differentiation and functional activity of EPCs.

Materials and methods: Peripheral blood mononuclear cells were cultured for 1 week to obtain early EPCs. Fibrin was characterized for stiffness and capability to sustain cell population expansion at different fibrinogen-thrombin ratios. Viability, differentiation and angiogenic properties of EPCs were evaluated and compared to those of EPCs grown on fibronectin.

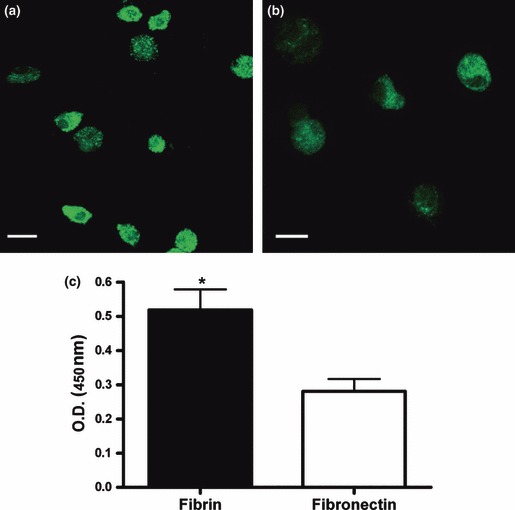
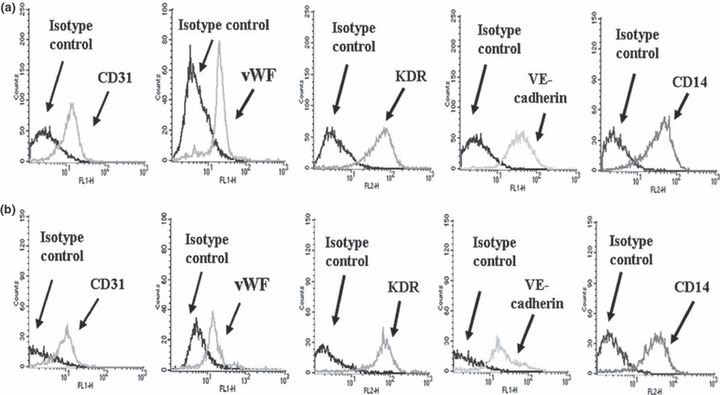
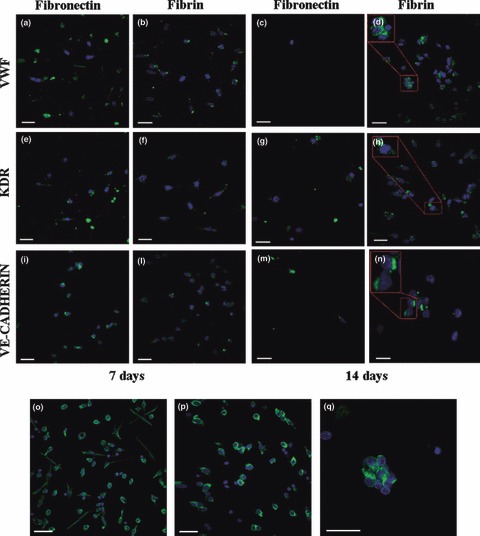
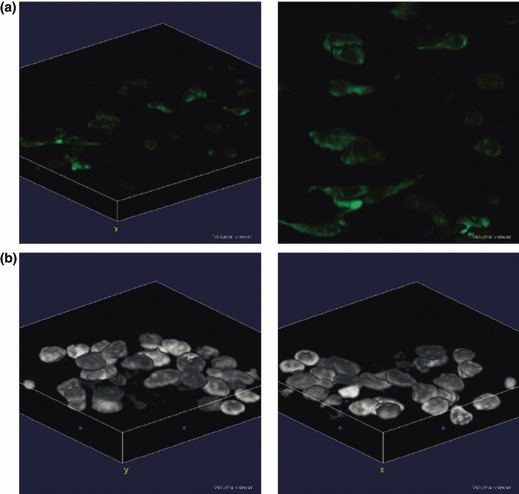
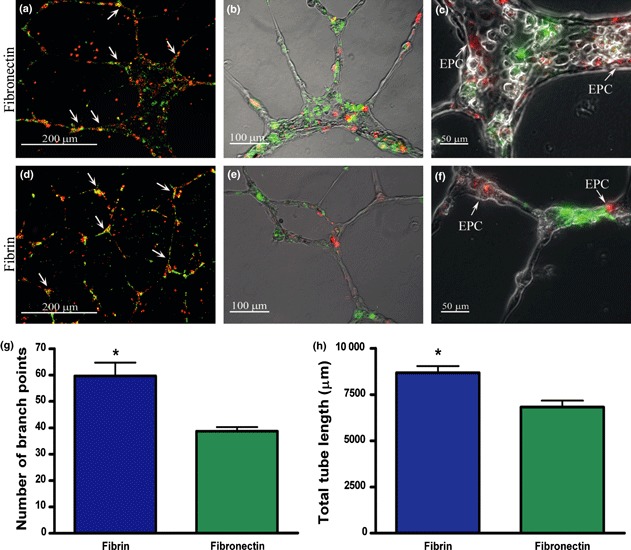
Results: Fibrin had a nanometric fibrous structure forming a porous network. Fibrinogen concentration significantly influenced fibrin stiffness and cell growth: 9 mg/ml fibrinogen and 25 U/ml thrombin was the best ratio for enhanced cell viability. Moreover, cell viability was significantly higher on fibrin compared to being on fibronectin. Even though no significant difference was observed in expression of endothelial markers, culture on fibrin elicited marked induction of stem cell markers OCT 3/4 and NANOG. In vitro angiogenesis assay on Matrigel showed that EPCs grown on fibrin retain angiogenetic capability as EPCs grown on fibronectin, but significantly better release of cytokines involved in cell recruitment was produced by EPC grown on fibrin.

Conclusion: Fibrin is a suitable matrix for EPC growth, differentiation and angiogenesis capability, suggesting that fibrin gel may be very useful for regenerative medicine.


Figures

Figure 1
Figure 1
Effect of fibrinogen concentration on fibrin stiffness and cell growth. (a) Stiffness measure of the different fibrin scaffolds. Stiffness was increased with higher fibrinogen concentration (**P <0.01 for 9/25 versus 36/25). (b) WST‐1 assay. Cell growth was reduced with increasing fibrinogen concentration (**P < 0.05 for 9/25 versus 36/25). Mean ± SEM of three different experiments.
Figure 2
Figure 2
Ultrastructural characteristics of fibrin. (a) Cryo‐SEM images of freeze‐fractured fibrin and (b) histogram representing frequency classes of porous surface areas. The internal microarchitecture is constituted by a complex plot of filaments producing micropores of very different size (10–100 μm) that allow cells to colonize the pores. Scale bar = 10 μm. (c) AFM friction image evidences a nanometric fibrous structure, the average diameter (on plane xy) of fibrin fibres is about 150–200 nm for the thicker fibres and 50 nm for the thinner fibres. In the representative height image the red line shows the section analysed for the measure of fibres’ height (on plane z) and the relative plot shows the height range (10–70 nm).
Figure 3
Figure 3
Cell viability. Cells cultured for 1 week on fibrin (a) or fibronectin (b) were incubated with calcein‐AM. Viable cells are evidenced by the presence of green staining in cell cytoplasm. Representative confocal laser scanning microphotographs are shown (n = 3). Scale bar = 10 μm. (c) Cells cultured for 1 week on fibrin or fibronectin were incubated with the tetrazolium salt WST‐1 for 4 h at 37 °C to produce a formazan dye, quantified by measuring the optical density at 450/655 nm. *P <0.05. Mean ± SEM of three different experiments.
Figure 4
Figure 4
EPC phenotype by flow cytometry. Representative flow cytometric analysis (n = 8) of markers of EPCs cultured for 1 week on fibronectin (a) or on fibrin (b). CD31, vWF, KDR, VE‐cadherin and CD14 staining histograms are shown, compared with their isotype control. Fluorescence intensity, proportional to the surface abundance of the antigen detected by the fluorescent‐labelled monoclonal antibody, is reported on the abscissa, while cell number is reported on the ordinate.
Figure 5
Figure 5
EPC phenotype and morphology by confocal laser scanning microscopy. EPCs were cultured either on fibronectin (left) or on fibrin (right), before staining with monoclonal antibodies for vWF (a–d), KDR (e–h) and Ve‐cadherin (i–l). The expression of the endothelial markers was evaluated at 7 (a, b, e, f, i, j) and 14 days (c, d, g, h, k, l). DAPI (blue) was added for counterstaining of cell nuclei. The expression of the endothelial antigens by EPCs grown on fibrin and fibronectin was comparable at day 7. At day 14, a high number of stained cells was observed only on fibrin. Scale bar = 20 μm. Vimentin staining (green) of EPC cultured for 1 week on fibronectin (m) or on fibrin (n). DAPI (blue) was added for counterstaining of cell nuclei. On fibronectin (m), three different cell morphologies were observed: small round cells with a thin cytoplasm ring around a central nucleus (1); larger irregular cells, scarcely elongated (2); bipolar elongated cells, with a central nucleus (3). On fibrin (n), most cells had a round shape (2), frequently aggregated in small clusters (o), and only a few elongated cells were present (1). Scale bar = 10 μm.
Figure 6
Figure 6
Z‐stack analysis of EPCs grown on fibrin. (a) EPCs were stained with an anti‐Vimentin monoclonal antibody and a FITC‐conjugated secondary antibody. (b) 3D analysis of EPC nuclei stained with DAPI.
Figure 7
Figure 7
Expression of stem cell markers. (a) Expression of NANOG and OCT 3/4 by Real‐time RT‐PCR at 4, 7 and 14 days. The expression of NANOG and OCT 3/4 was significantly higher on fibrin than on fibronectin at both 4 and 7 days (***P < 0.005). After 14 days, there was a down‐regulation in stem cell marker expression even if the expression remained significantly higher on fibrin (*P < 0.05 for NANOG and ***P < 0.005 for OCT 3/4). Mean ± SEM of six different experiments. (b) Expression of OCT 3/4 and NANOG protein by confocal microscopy. The OCT 3/4 and NANOG protein expression was mainly visible on fibrin at 4–7 and 14 days. Scale bar: 10 μm.
Figure 8
Figure 8
EPC contribution in tubules formed by human umbilical vein endothelial cells (HUVECs) on Matrigel. Cells were observed under a fluorescent microscope and pictures taken at lower magnification were used for fluorescence quantification. Representative merged pictures of EPCs grown on fibronectin (a) and fibrin (d) are shown. The average ratio between EPCs (red) and HUVEC (green) per low power field was comparable (p = n.s.) between EPCs grown on fibrin (41.79 ± 1.36 a.u.) or EPCs grown on fibronectin (31.59 ± 5.70 a.u.). Figure 7b,e show the merged images of labelled cells in the bright field to visualize the structure of tubes better. Figure 7c,f are a magnification of tubular structures, showing the distribution of EPC on capillary structures formed by HUVECs. Scale bars: 200 μm (a, d), 100 μm (b, e), 50 μm (c, f). Number of branch points (g) and total tube length (h) of HUVEC networks were also calculated. Ability of HUVEC to form capillary‐like sprouts was significantly higher when co‐plated with EPCs detached from fibrin than from fibronectin (*P < 0.05). Mean ± SEM from three experiments.
Figure 9
Figure 9
Cytokine release by EPCs cultured either on fibrin or on fibronectin. Cytokine release was statistically increased in supernatants of EPC compared with HUVECs (δδ < 0.01; δδδ < 0.001 versus HUVECs, n = 5). IL‐16, PDGF‐BB, MIF, SDF‐1, HGF, IP10 and MIG were statistically higher when EPCs were grown on fibrin than on fibronectin (*P < 0.05; ***P < 0.001 versus fibronectin, n = 5), while MCFS, Gro‐α, IL‐8 and MCP‐1 were expressed in a comparable way on both matrices.

References

    1. Hamdi H, Furuta A, Bellamy V, Bel A, Puymirat E, Peyrard S et al. (2009) Cell delivery: intramyocardial injections or epicardial deposition? A head‐to‐head comparison Ann. Thorac. Surg. 87, 1196–1203. - PubMed
    1. Shaikh FM, Callanan A, Kavanagh EG, Burke PE, Grace PA, McGloughlin TM (2008) Fibrin: a natural biodegradable scaffold in vascular tissue engineering. Cells Tissues Organs 188, 333–346. - PubMed
    1. Janmey PA, Winer JP, Weisel JW (2009) Fibrin gels and their clinical and bioengineering applications. J. R. Soc. Interface 6, 1–10. - PMC - PubMed
    1. Nakatsu MN, Sainson RC, Aoto JN, Taylor KL, Aitkenhead M, Perez‐del‐Pulgar S et al. (2003) Angiogenic sprouting and capillary lumen formation modeled by human umbilical vein endothelial cells (HUVEC) in fibrin gels: the role of fibroblasts and Angiopoietin‐1. Microvasc. Res. 66, 102–112. - PubMed
    1. Cox S, Cole M, Tawil B (2004) Behavior of human dermal fibroblasts in three‐dimensional fibrin clots: dependence on fibrinogen and thrombin concentration. Tissue Eng. 10, 942–954. - PubMed

Publication types

MeSH terms