. 2011 Jan;13(1):135-144.
doi: 10.1111/j.1462-2920.2010.02315.x.

Global patterns in the biogeography of bacterial taxa

Affiliations

Global patterns in the biogeography of bacterial taxa

Diana R Nemergut et al. Environ Microbiol. 2011 Jan.

Abstract

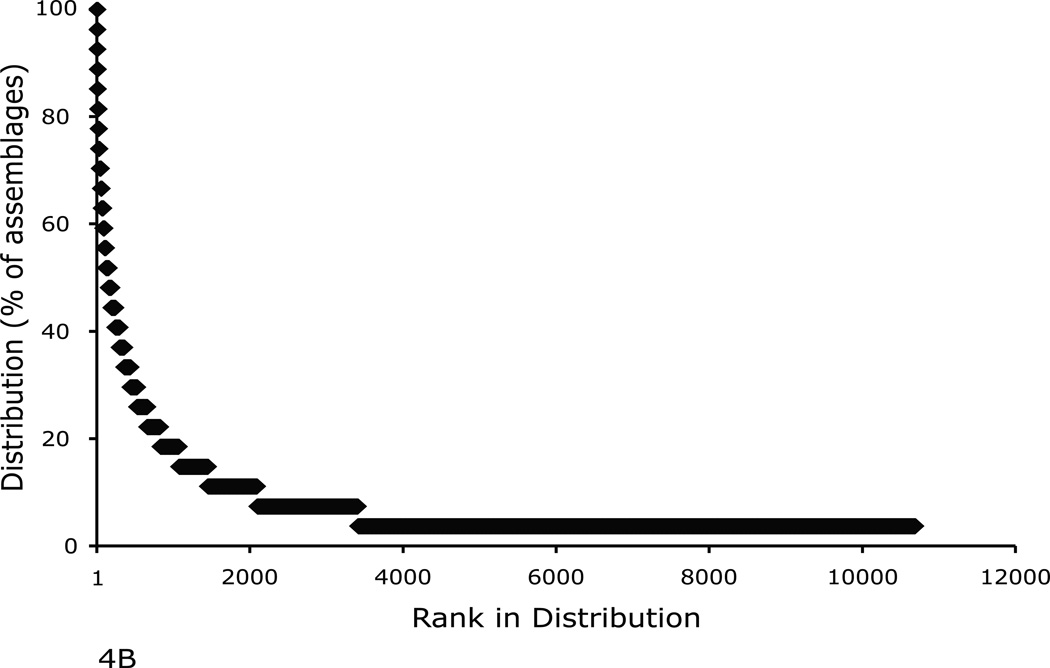
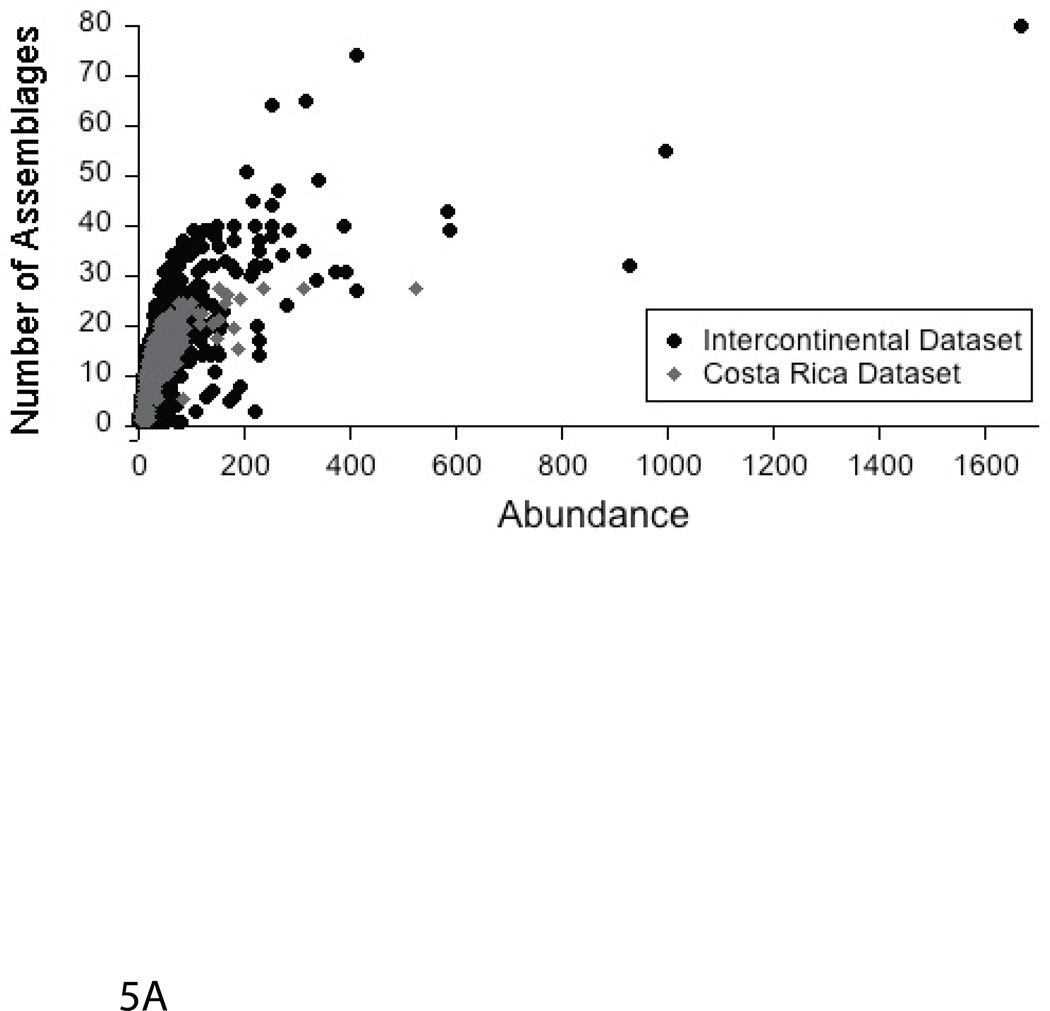
Bacteria control major nutrient cycles and directly influence plant, animal and human health. However, we know relatively little about the forces shaping their large-scale ecological ranges. Here, we reveal patterns in the distribution of individual bacterial taxa at multiple levels of phylogenetic resolution within and between Earth's major habitat types. Our analyses suggest that while macro-scale habitats structure bacterial distribution to some degree, abundant bacteria (i.e. detectable using 16S rRNA gene sequencing methods) are confined to single assemblages. Additionally, we show that the most cosmopolitan taxa are also the most abundant in individual assemblages. These results add to the growing body of data that support that the diversity of the overall bacterial metagenome is tremendous. The mechanisms governing microbial distribution remain poorly understood, but our analyses provide a framework with which to test the importance of macro-ecological environmental gradients, relative abundance, neutral processes and the ecological strategies of individual taxa in structuring microbial communities.


Figures

Fig. 1
Fig. 1
A. The number of OTUs that were found in different proportions of assemblages within our clone library dataset (Table S1), which contains 28,115 sequences and 238 assemblages. At all OTU definitions, the vast majority of lineages were observed in only a single assemblage. B. The relative abundance of different phyla within the clone library dataset. Phyla that represent at least 2% of all sequences are labeled.
Fig. 1
Fig. 1
A. The number of OTUs that were found in different proportions of assemblages within our clone library dataset (Table S1), which contains 28,115 sequences and 238 assemblages. At all OTU definitions, the vast majority of lineages were observed in only a single assemblage. B. The relative abundance of different phyla within the clone library dataset. Phyla that represent at least 2% of all sequences are labeled.
Fig. 2
Fig. 2
Rank distribution plots displaying the presence of OTUs in different numbers of habitat types. At all OTU definitions, the vast majority of lineages were observed in only a single habitat type.
Fig. 3
Fig. 3
The rank in distribution plotted against the percent of assemblages each OTU was found in for (A) soils (n=49), (B) lakewater (n=21), (C) freshwater sediments (n=15), (D) seawater (n=40), (E) saline sediments (n=36), (F) and insect associated samples (n=15) for the clone library data. Those OTUs that were most widely dispersed within habitat types are indicated. Within habitat types, some OTUs were widely distributed among assemblages while the majority were limited to only a few assemblages.
Fig. 4
Fig. 4
The rank in distribution plotted against the percent of assemblages each OTU was found in for (A) the inter-continental soils dataset (n=88) and (B) the tropical forest (intra-hectare) soils dataset (n=27).
Fig. 4
Fig. 4
The rank in distribution plotted against the percent of assemblages each OTU was found in for (A) the inter-continental soils dataset (n=88) and (B) the tropical forest (intra-hectare) soils dataset (n=27).
Fig. 5
Fig. 5
The relationship between abundance and distribution of OTUs. A. The grey diamonds represent OTUs from the tropical forest dataset; the black circles represent OTUs from the trans-continental (Lauber et al. 2009) dataset. Here, we plotted the total abundance (within the entire dataset) of each OTU against its distribution. However, we also examined the relationship between the average of the relative abundance of each OTU within all assemblages against its distribution, which yielded similar results (data not shown). B. Heatmaps of the top ten most abundant OTUs for each study (tropical forest soils = top, intercontinental soils= bottom) showing the abundance of each OTU in each assemblage relative to its total abundance across the dataset. Each column represents a different assemblage; each row represents a different OTU; the color of the cells represents the relative abundance of that OTU within specific assemblages.
Fig. 5
Fig. 5
The relationship between abundance and distribution of OTUs. A. The grey diamonds represent OTUs from the tropical forest dataset; the black circles represent OTUs from the trans-continental (Lauber et al. 2009) dataset. Here, we plotted the total abundance (within the entire dataset) of each OTU against its distribution. However, we also examined the relationship between the average of the relative abundance of each OTU within all assemblages against its distribution, which yielded similar results (data not shown). B. Heatmaps of the top ten most abundant OTUs for each study (tropical forest soils = top, intercontinental soils= bottom) showing the abundance of each OTU in each assemblage relative to its total abundance across the dataset. Each column represents a different assemblage; each row represents a different OTU; the color of the cells represents the relative abundance of that OTU within specific assemblages.

References

    1. Anderson MJ. A new method for non-parametric multivariate analysis of variance. Austral Ecol. 2001;26:32–46.
    1. Ashby MN, Rine J, Mongodin EF, Nelson KE, Dimster-Denk D. Serial analysis of rRNA genes and the unexpected dominance of rare members of microbial communities. Appl Environ Microbiol. 2007;73:4532–4542. - PMC - PubMed
    1. Auguet J-C, Barberan A, Casamayor EO. Global ecological patterns in uncultured Archaea. ISME Journal. 2010;4:1–9. - PubMed
    1. Brown JH. On the relationship between abundance and distribution of species. Am Nat. 1984;124:255–279.
    1. Brown JH, Lomolino MV. Biogeography. 2 edn. Sunderland, MA: Sinauer; 1998.

Publication types

Substances