

(R)-[11C]verapamil PET studies to assess changes in P-glycoprotein expression and functionality in rat blood-brain barrier after exposure to kainate-induced status epilepticus
- PMID: 21199574
- PMCID: PMC3022839
- DOI: 10.1186/1471-2342-11-1
(R)-[11C]verapamil PET studies to assess changes in P-glycoprotein expression and functionality in rat blood-brain barrier after exposure to kainate-induced status epilepticus
Abstract
Background: Increased functionality of efflux transporters at the blood-brain barrier may contribute to decreased drug concentrations at the target site in CNS diseases like epilepsy. In the rat, pharmacoresistant epilepsy can be mimicked by inducing status epilepticus by intraperitoneal injection of kainate, which leads to development of spontaneous seizures after 3 weeks to 3 months. The aim of this study was to investigate potential changes in P-glycoprotein (P-gp) expression and functionality at an early stage after induction of status epilepticus by kainate.
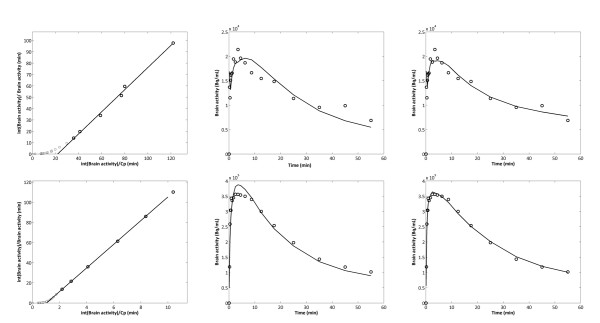
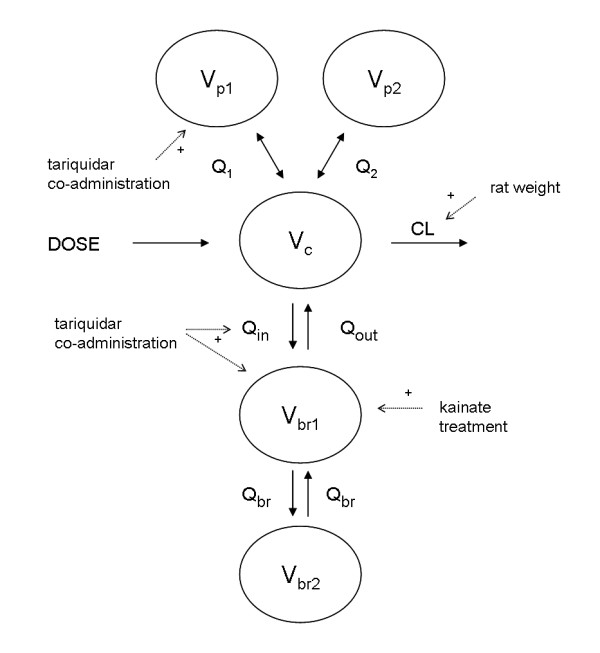
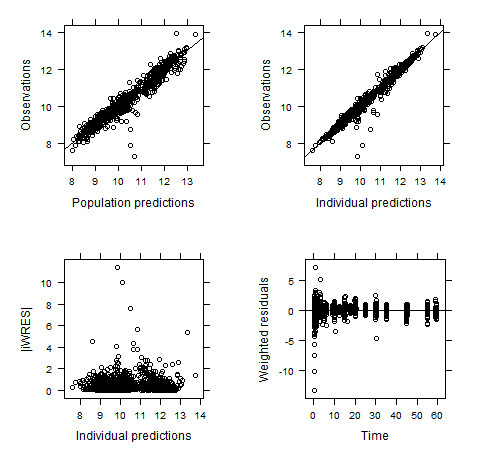
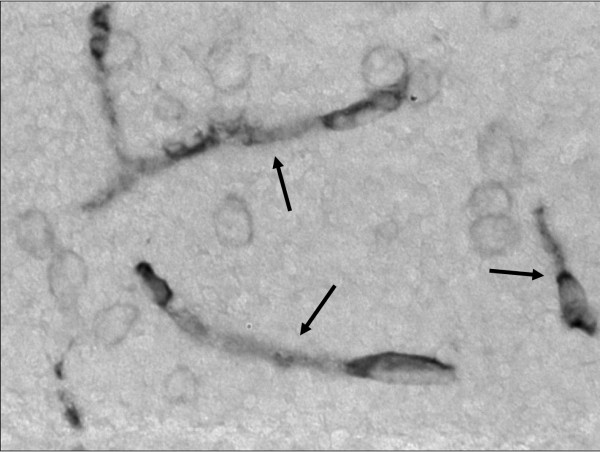
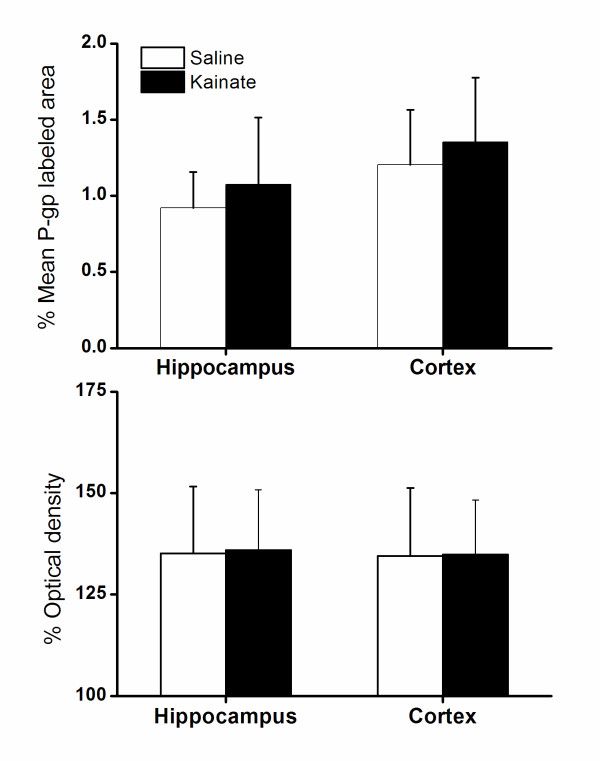
Methods: (R)-[11C]verapamil, which is currently the most frequently used positron emission tomography (PET) ligand for determining P-gp functionality at the blood-brain barrier, was used in kainate and saline (control) treated rats, at 7 days after treatment. To investigate the effect of P-gp on (R)-[11C]verapamil brain distribution, both groups were studied without or with co-administration of the P-gp inhibitor tariquidar. P-gp expression was determined using immunohistochemistry in post mortem brains. (R)-[11C]verapamil kinetics were analyzed with approaches common in PET research (Logan analysis, and compartmental modelling of individual profiles) as well as by population mixed effects modelling (NONMEM).
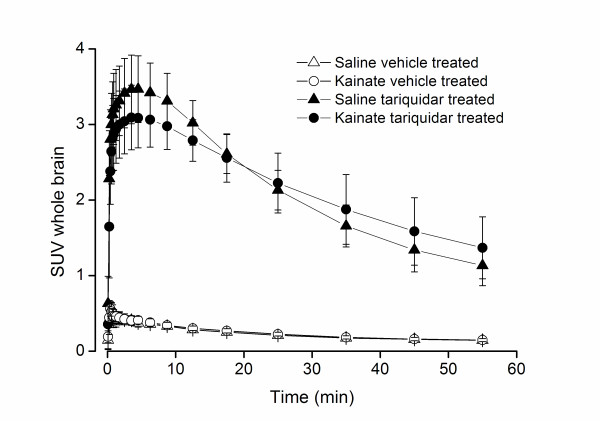
Results: All data analysis approaches indicated only modest differences in brain distribution of (R)-[11C]verapamil between saline and kainate treated rats, while tariquidar treatment in both groups resulted in a more than 10-fold increase. NONMEM provided most precise parameter estimates. P-gp expression was found to be similar for kainate and saline treated rats.
Conclusions: P-gp expression and functionality does not seem to change at early stage after induction of anticipated pharmacoresistant epilepsy by kainate.
Figures
Similar articles
-
Tariquidar-induced P-glycoprotein inhibition at the rat blood-brain barrier studied with (R)-11C-verapamil and PET.J Nucl Med. 2008 Aug;49(8):1328-35. doi: 10.2967/jnumed.108.051235. Epub 2008 Jul 16. J Nucl Med. 2008. PMID: 18632828 Free PMC article.
-
A novel positron emission tomography imaging protocol identifies seizure-induced regional overactivity of P-glycoprotein at the blood-brain barrier.J Neurosci. 2011 Jun 15;31(24):8803-11. doi: 10.1523/JNEUROSCI.6616-10.2011. J Neurosci. 2011. PMID: 21677164 Free PMC article.
-
A pilot study to assess the efficacy of tariquidar to inhibit P-glycoprotein at the human blood-brain barrier with (R)-11C-verapamil and PET.J Nucl Med. 2009 Dec;50(12):1954-61. doi: 10.2967/jnumed.109.063289. Epub 2009 Nov 12. J Nucl Med. 2009. PMID: 19910428 Free PMC article. Clinical Trial.
-
11C-verapamil to assess P-gp function in human brain during aging, depression and neurodegenerative disease.Curr Top Med Chem. 2010;10(17):1775-84. doi: 10.2174/156802610792928059. Curr Top Med Chem. 2010. PMID: 20645917 Review.
-
Kinetic Models for Measuring P-glycoprotein Function at the Blood-Brain Barrier with Positron Emission Tomography.Curr Pharm Des. 2016;22(38):5786-5792. doi: 10.2174/1381612822666160804093852. Curr Pharm Des. 2016. PMID: 27494063 Review.
Cited by
-
[11C]Flumazenil brain uptake is influenced by the blood-brain barrier efflux transporter P-glycoprotein.EJNMMI Res. 2012 Mar 28;2:12. doi: 10.1186/2191-219X-2-12. EJNMMI Res. 2012. PMID: 22455873 Free PMC article.
-
Neuroimaging Biomarkers of Experimental Epileptogenesis and Refractory Epilepsy.Int J Mol Sci. 2019 Jan 8;20(1):220. doi: 10.3390/ijms20010220. Int J Mol Sci. 2019. PMID: 30626103 Free PMC article. Review.
-
Synthesis and preliminary preclinical evaluation of fluorine-18 labelled isatin-4-(4-methoxyphenyl)-3-thiosemicarbazone ([18F]4FIMPTC) as a novel PET tracer of P-glycoprotein expression.EJNMMI Radiopharm Chem. 2018 Sep 21;3:11. doi: 10.1186/s41181-018-0046-z. eCollection 2018 Dec. EJNMMI Radiopharm Chem. 2018. PMID: 30294663 Free PMC article.
-
[11C]phenytoin revisited: synthesis by [11C]CO carbonylation and first evaluation as a P-gp tracer in rats.EJNMMI Res. 2012 Jul 2;2(1):36. doi: 10.1186/2191-219X-2-36. EJNMMI Res. 2012. PMID: 22747744 Free PMC article.
-
Alteration in P-glycoprotein functionality affects intrabrain distribution of quinidine more than brain entry-a study in rats subjected to status epilepticus by kainate.AAPS J. 2012 Mar;14(1):87-96. doi: 10.1208/s12248-011-9318-1. Epub 2012 Jan 4. AAPS J. 2012. PMID: 22215264 Free PMC article.
References
Publication types
MeSH terms
Substances
LinkOut - more resources
Full Text Sources
Miscellaneous
