. 2011 Jan 1;71(1):19-28.
doi: 10.1158/0008-5472.CAN-10-2602.

Glioblastoma recurrence after cediranib therapy in patients: lack of "rebound" revascularization as mode of escape

Affiliations

Glioblastoma recurrence after cediranib therapy in patients: lack of "rebound" revascularization as mode of escape

Emmanuelle di Tomaso et al. Cancer Res. .

Erratum in

  • Cancer Res. 2011 Mar 15;71(6):2405

Abstract

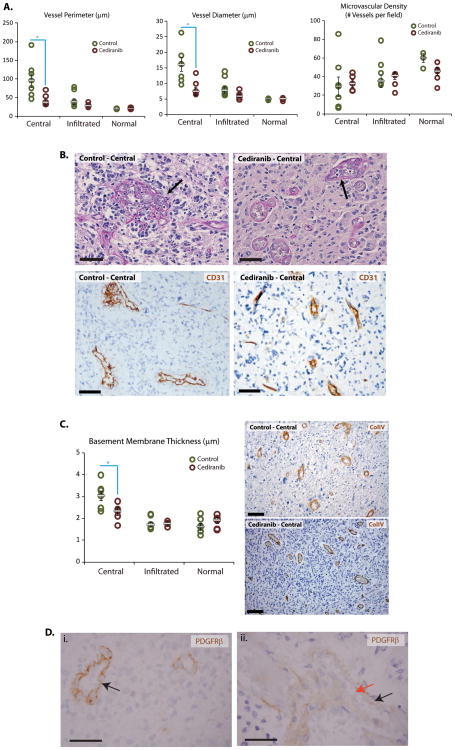
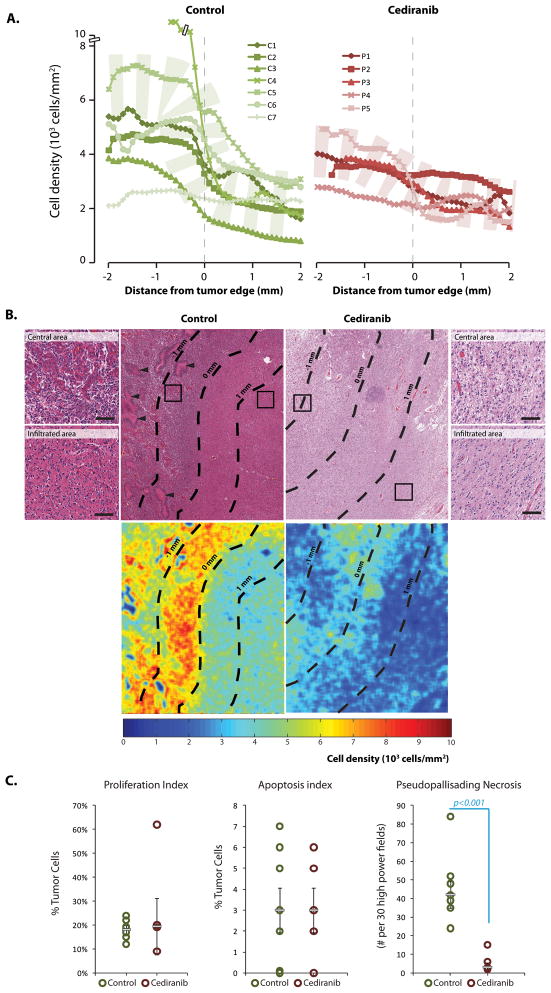
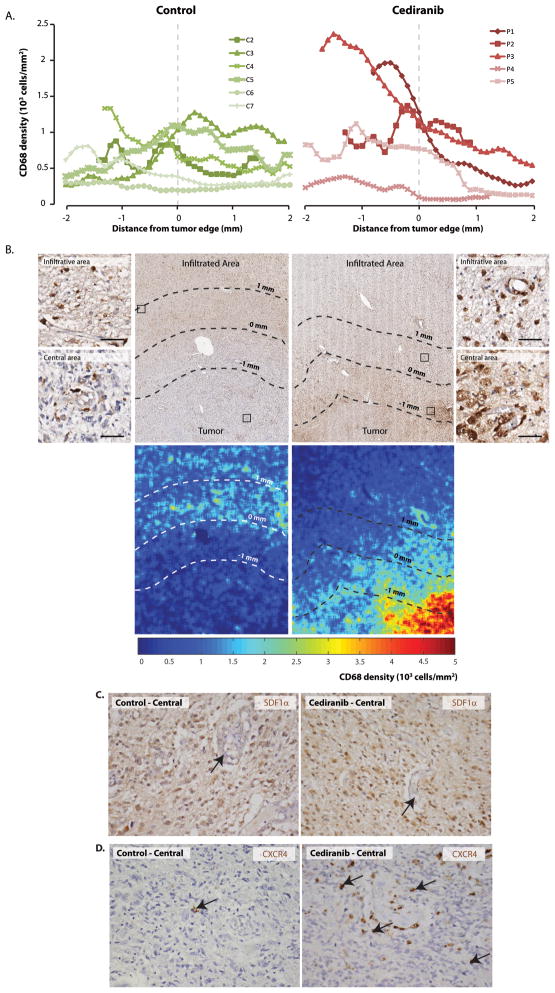
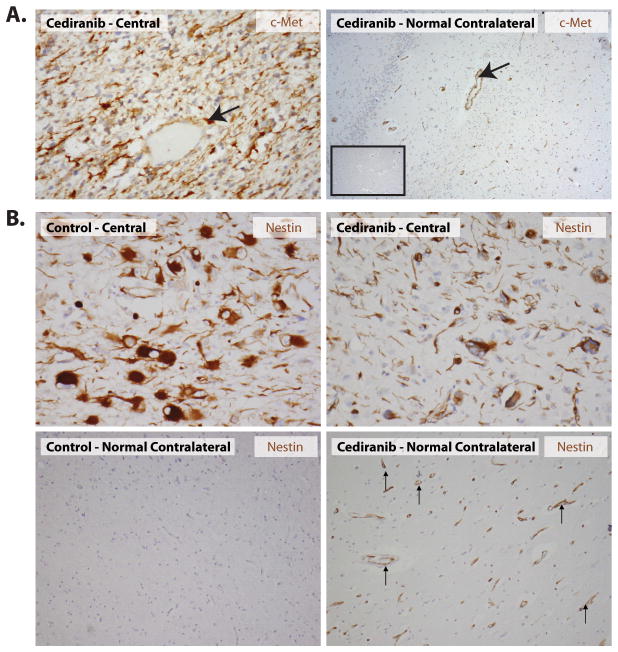
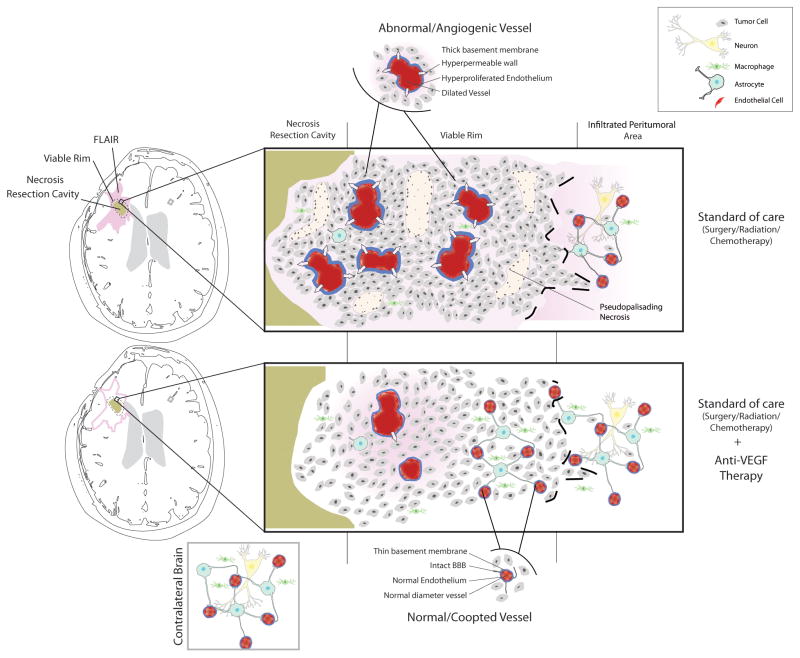
Recurrent glioblastomas (rGBM) invariably relapse after initial response to anti-VEGF therapy. There are 2 prevailing hypotheses on how these tumors escape antiangiogenic therapy: switch to VEGF-independent angiogenic pathways and vessel co-option. However, direct evidence in rGBM patients is lacking. Thus, we compared molecular, cellular, and vascular parameters in autopsy tissues from 5 rGBM patients who had been treated with the pan-VEGF receptor tyrosine kinase inhibitor cediranib versus 7 patients who received no therapy or chemoradiation but no antiangiogenic agents. After cediranib treatment, endothelial proliferation and glomeruloid vessels were decreased, and vessel diameters and perimeters were reduced to levels comparable to the unaffected contralateral brain hemisphere. In addition, tumor endothelial cells expressed molecular markers specific to the blood-brain barrier, indicative of a lack of revascularization despite the discontinuation of therapy. Surprisingly, in cediranib-treated GBM, cellular density in the central area of the tumor was lower than in control cases and gradually decreased toward the infiltrating edge, indicative of a change in growth pattern of rGBMs after cediranib treatment, unlike that after chemoradiation. Finally, cediranib-treated GBMs showed high levels of PDGF-C (platelet-derived growth factor C) and c-Met expression and infiltration by myeloid cells, which may potentially contribute to resistance to anti-VEGF therapy. In summary, we show that rGBMs switch their growth pattern after anti-VEGF therapy--characterized by lower tumor cellularity in the central area, decreased pseudopalisading necrosis, and blood vessels with normal molecular expression and morphology--without a second wave of angiogenesis.


Figures

Figure 1
Figure 1. Vascular changes after cediranib treatment
A: Quantification of vessel perimeters and diameters in central and infiltrative areas of tumor as well as normal brain tissue in control patients or after cediranib by CD31 immunohistochemistry shows broad variability in central areas of control cases and a narrower spectrum after cediranib treatment. Cediranib-treated tumor vessels have a significantly smaller average perimeter and diameter in the central area (p=0.02), very close to that of normal brain capillaries. Quantification of microvascular density shows that cediranib treated tumors have a similar microvascular density in the central and infiltrating areas and that these are similar to the microvascular density of uninvolved brain. Microvascular density of control cases has a broader variation in the central and infiltrated areas. B: Microvascular proliferation typical of GBM vessels was abundant in all control cases (black arrow); however it was decreased in cediranib-treated patients (arrow points at the most abnormal vessel lining). Periodic and Schiff stain and CD31 immunohistochemistry highlight abnormal vascular morphology. C: Cediranib-treated tumor vessels in the central areas have a thinner basement membrane (p=0.03), similar to normal vessels (Collagen IV immunohistochemistry). Immunohistochemistry for Collagen IV shows marked thickening of the basement membranes in the central are of the control tumors and thinner basement membranes of the vessels in the cediranib treated tumors. D: Immunohistochemistry highlights expression of PDGFRbeta by the endothelial cells in diagnostic biopsy tissue from one of the patients (i-arrow). Autopsy tissue from the same patient after cediranib therapy (ii) displayed mostly PDGFRbeta negative vessels (endothelium unstained, red arrow) while the perivascular cells are positive for PDGFRbeta as expected for normal brain vessels (black arrow). Scale bar corresponds to 50μm.
Figure 2
Figure 2. Cell density in recurrent glioblastoma (GBMs) after cediranib treatment
A: GBMs without previous antiangiogenic treatment (control) have a broad spectrum of cell density within the center of the tumor with a sharp drop in nuclear density in the infiltrating edge, where nuclear density is less variable. Cediranib treated patients show overall decreased cell density in the central area of the tumor compared to the patients not treated with antiangiogenic agent, with a more gradual and less steep drop of cell density in the infiltrating edge. B: Low power and high power (inserts) power hematoxylin & eosin examination and nuclear density heat map reveal that central areas of the control cases have strikingly high nuclear density, abundant vascular proliferation (top left insert) and pseudopalisading necrosis (arrow heads). In cediranib-treated tumors infiltrating and central areas have a similar nuclear density (scale bar corresponds to 100μm). C: Ki-67 index and apoptotic index in the central areas did not show difference proliferation rate or cell death between control cases and cediranib treated cases. Cediranib treated rGBMs showed significantly lower number of foci with pseudopalisading necrosis in the central area of the tumor (p-value<0.001).
Figure 3
Figure 3. Tumor-infiltrating myeloid cells, SDF1α and CXCR4 in cediranib treated rGBM
A and B: Quantification of CD68 positive cells show similar numbers of macrophages in the central and infiltrating areas of control cases. Tumors from cediranib treated patients showed a trend towards higher numbers of macrophages in the central area, while the numbers of macrophages in the infiltrating areas are similar to control cases. Immunohistochemistry for CD68 also reveals close association between macrophages and blood vessels (B, inserts). (scale bar corresponds to 50μm). C: Although we did not observe difference in expression of SDF1α (C) or CXCR4 (D) in tumor cells, control cases showed few CXCR4 tumor associated macrophages (3D left panel, arrow) while cediranib treated tumor contained many perivascular CXCR4 positive cells in the central area of the tumor (3D right panel, arrows).
Figure 4
Figure 4. Expression of c-Met and Nestin in n cediranib treated rGBM
A: Diffuse c-Met expression was seen in several tumor cells as well as blood vessels (arrow) within the tumor areas after cediranib treatment. The blood vessels in the contra-lateral brain tissue (not involved by the tumor) of cediranib treated patients also expressed c-Met (right panel, arrow) while this was not seen in control autopsy cases (inset), where vessels in the brain tissue not involved by the tumor were negative. B: Nestin expression in the central area of the tumor (top left and right panel) is present in the tumor cells and vessels in both cediranib treated and control tumors. Of note, vessels were also nestin-positive in the normal contralateral part of the brain in cediranib treated patients (bottom right panel). This phenomenon was not seen in the control specimen (bottom left panel).
Figure 5
Figure 5. Model of changes in infiltrating behavior of recurrent GBM induced by cediranib
The central area of a viable rGBM has high cell density with numerous abnormal leaky vessels, numerous foci of pseudopalisading necrosis and tumor cells which infiltrate surrounding normal brain (top panel). Anti-VEGF therapy (bottom panel) leads to decreased number of abnormal leaky vessels and lack of pseudopalisading necrosis. Cellular density in the central area is decreased while number of tumor cells in the infiltrating edge is similar to control cases.

References

    1. Jain RK, di Tomaso E, Duda DG, Loeffler JS, Sorensen AG, Batchelor TT. Angiogenesis in brain tumours. Nature reviews. 2007;8(8):610–22. - PubMed
    1. Plate KH, Mennel HD. Vascular morphology and angiogenesis in glial tumors. Exp Toxicol Pathol. 1995;47(2–3):89–94. - PubMed
    1. Rampling R, Cruickshank G, Lewis A, Fitzsimmon S, Workman P. Direct measurment of PO2 distribution and bioreductive enzymes in human malignant brain tumors. Int J Radiat Oncol Biol Phys. 1994;29(3):427–31. - PubMed
    1. Valk PE, Mathis CA, Prados MD, Gilbert JC, Budinger TF. Hypoxia in human gliomas: demonstration by PET with fluorine-18-fluoromisonidazole. J Nucl Med. 1992;33(12):2133–7. - PubMed
    1. Guo P, Hu B, Gu W, et al. Platelet-derived growth factor-B enhances glioma angiogenesis by stimulating vascular endothelial growth factor expression in tumor endothelia and by promoting pericyte recruitment. Am J Pathol. 2003;162(4):1083–93. - PMC - PubMed

Publication types

MeSH terms