. 2011 Mar 4;286(9):7522-34.
doi: 10.1074/jbc.M110.155895. Epub 2011 Jan 3.

The Ca2+-dependent phosphatase calcineurin controls the formation of the Carma1-Bcl10-Malt1 complex during T cell receptor-induced NF-kappaB activation

Affiliations

The Ca2+-dependent phosphatase calcineurin controls the formation of the Carma1-Bcl10-Malt1 complex during T cell receptor-induced NF-kappaB activation

Lysann Palkowitsch et al. J Biol Chem. .

Abstract

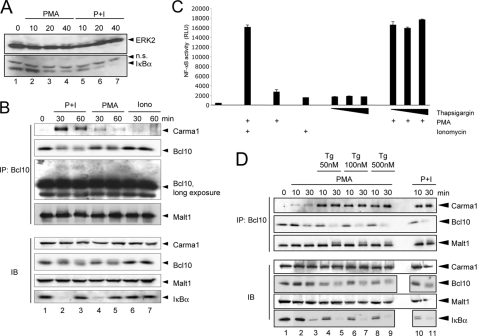
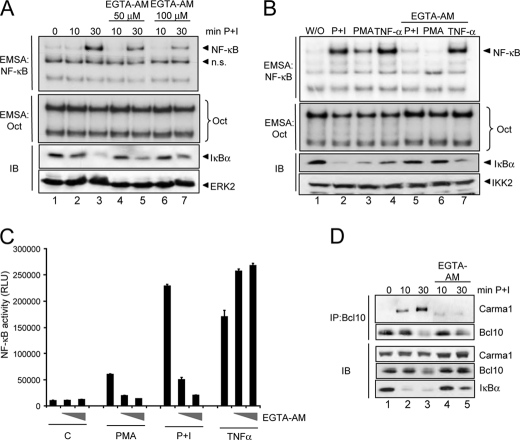
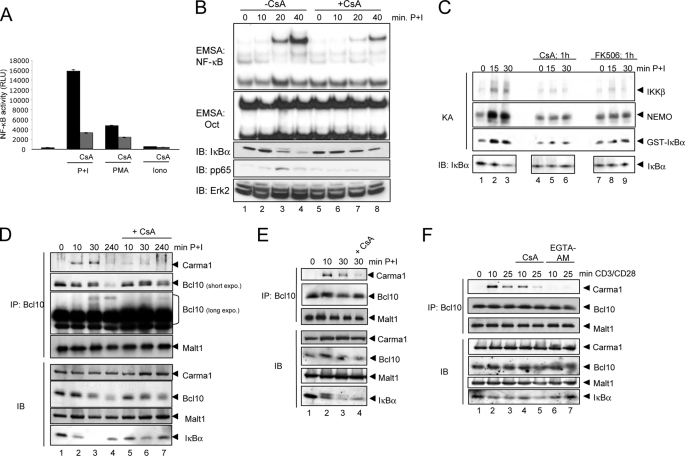
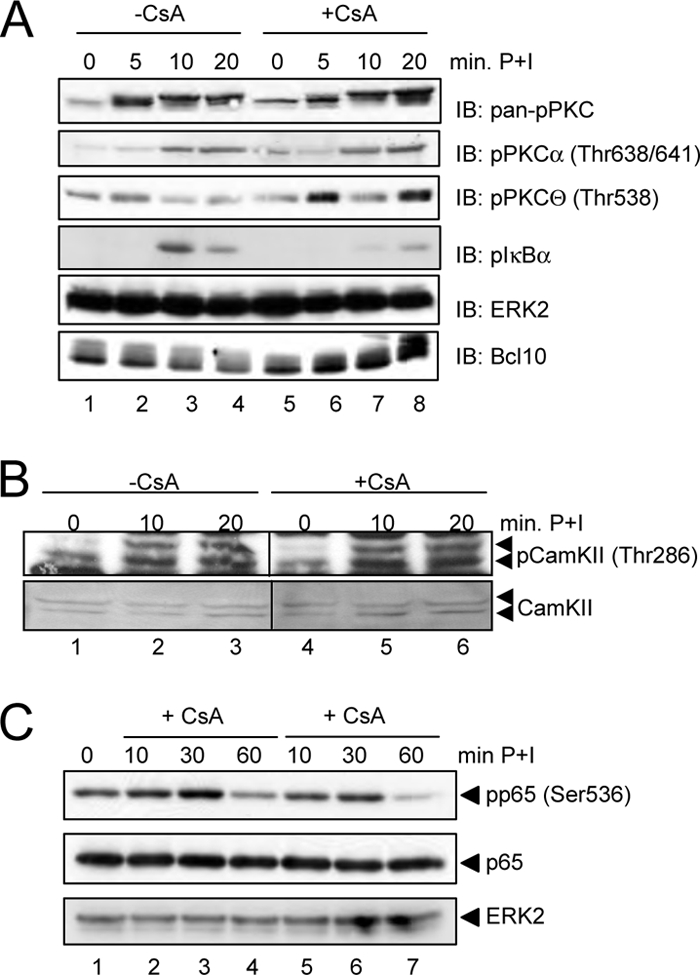
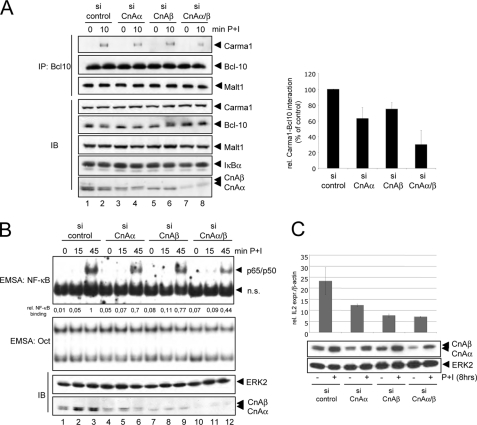
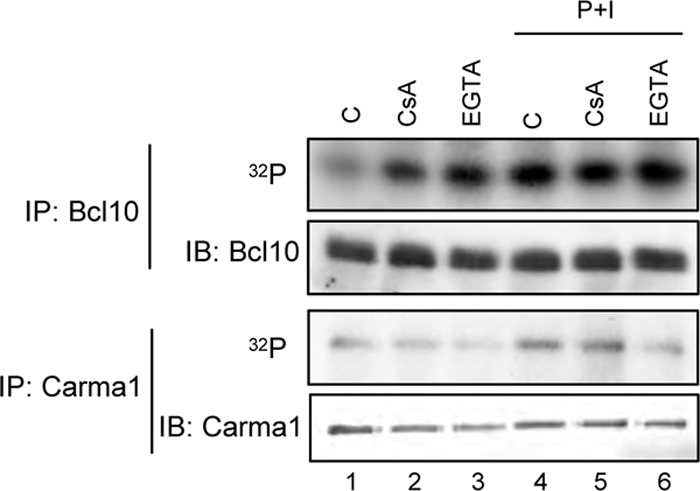
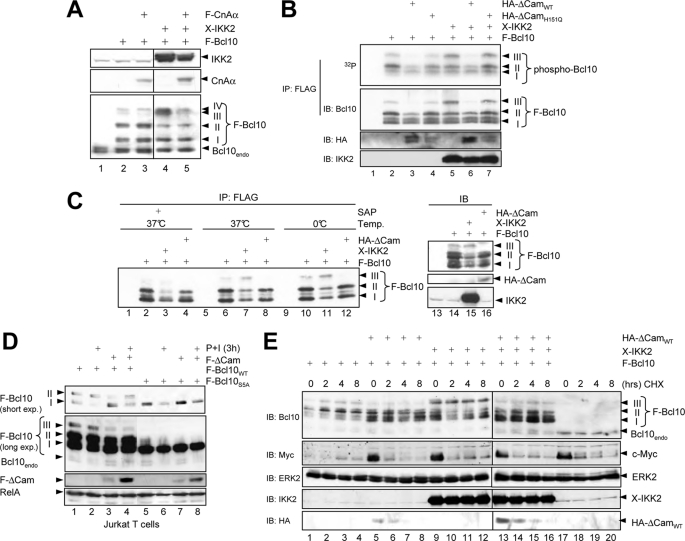
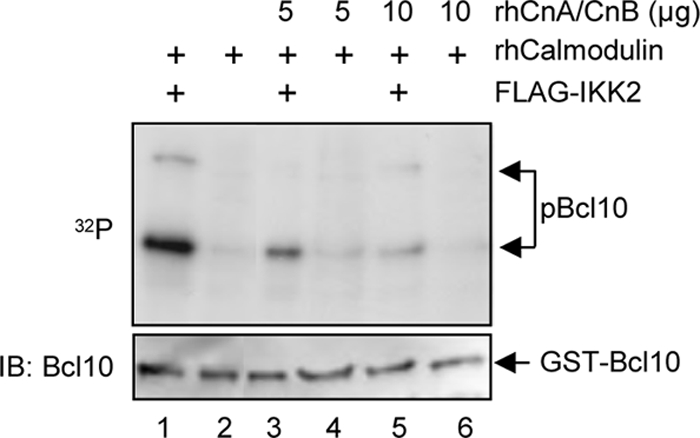
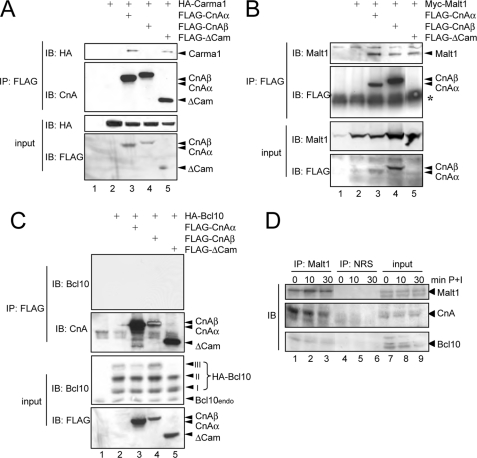
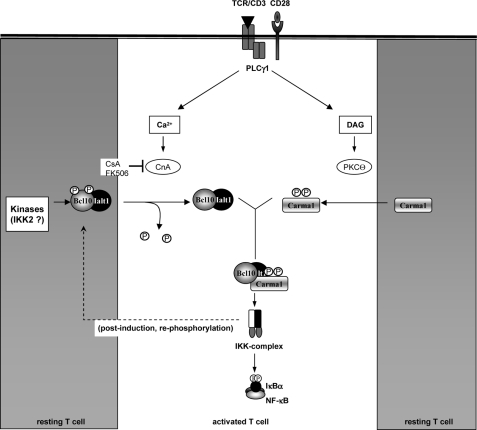
T cell receptor (TCR) ligation induces increased diacylglycerol and Ca(2+) levels in T cells, and both secondary messengers are crucial for TCR-induced nuclear factor of activated T cells (NF-AT) and NF-κB signaling pathways. One prominent calcium-dependent enzyme involved in the regulation of NF-AT and NF-κB signaling pathways is the protein phosphatase calcineurin. However, in contrast to NF-AT, which is directly dephosphorylated by calcineurin, the molecular basis of the calcium-calcineurin dependence of the TCR-induced NF-κB activity remains largely unknown. Here, we demonstrate that calcineurin regulates TCR-induced NF-κB activity by controlling the formation of a protein complex composed of Carma1, Bcl10, and Malt1 (CBM complex). For instance, increased calcium levels induced by ionomycin or thapsigargin augmented the phorbol 12-myristate 13-acetate-induced formation of the CBM complex and activation of NF-κB, whereas removal of calcium by the calcium chelator EGTA-acetoxymethyl ester (AM) attenuated both processes. Furthermore, inhibition of the calcium-dependent phosphatase calcineurin with the immunosuppressive agent cyclosporin A (CsA) or FK506 as well as siRNA-mediated knockdown of calcineurin A strongly affected the PMA + ionomycin- or anti-CD3 + CD28-induced CBM complex assembly. Mechanistically, the positive effect of calcineurin on the CBM complex formation seems to be linked to a dephosphorylation of Bcl10. For instance, Bcl10 was found to be hyperphosphorylated in Jurkat T cells upon treatment with CsA or EGTA-AM, and calcineurin dephosphorylated Bcl10 in vivo and in vitro. Furthermore, we show here that calcineurin A interacts with the CBM complex. In summary, the evidence provided here argues for a previously unanticipated role of calcineurin in CBM complex formation as a molecular basis of the inhibitory function of CsA or FK506 on TCR-induced NF-κB activity.


Figures

FIGURE 1.
FIGURE 1.
Calcium augments the PMA-induced formation of the CBM complex. A, Jurkat T cells were stimulated with either PMA alone (50 ng/ml) or with a combination of PMA plus ionomycin for the indicated time points. Subsequently, anti-IκBα and anti-ERK2 immunoblots were performed. n.s., nonspecific. B, Bcl10 was immunoprecipitated (IP) from TNT lysates (500 μg of protein/sample) of untreated or P+I-stimulated Jurkat T cells (50 ng/ml PMA, 500 ng/ml ionomycin). The resulting immunopurified protein complexes were subjected to immunoblot analyses (IB) with the indicated antibodies. To determine the cellular levels of the CBM components, control immunoblot analyses were performed with the indicated antibodies. C, NF-κB activity upon PMA, ionomycin, or thapsigargin stimulation for 24 h was monitored by determining the luciferase activity in stably transfected Jur4 cells. All stimulations were performed in duplicate, and the mean value and S.E. (error bars) are depicted. D, anti-Bcl10 immunoprecipitation analysis using whole cell extracts from unstimulated Jurkat T cells or from Jurkat T cells pretreated with the indicated concentrations of thapsigargin (60 min) and subsequently stimulated with PMA or PMA + ionomycin for the stated times.
FIGURE 2.
FIGURE 2.
Signal-specific attenuation of NF-κB activity by the calcium chelator EGTA-AM. A, Jurkat T cells were either left untreated or were pretreated with the indicated concentrations of EGTA-AM for 30 min prior to stimulation with PMA + ionomycin as indicated. The resulting whole cell extracts were used for EMSA experiments with 32P-labeled NF-κB-specific or Oct-specific oligonucleotides. Additionally, immunoblot analyses (IB) were performed using the indicated antibodies. n.s., nonspecific. B, a similar experiment was performed using Jurkat T cells that were either left untreated or pretreated with 100 μm EGTA-AM and subsequently stimulated with PMA + ionomycin, PMA, or TNF-α, as indicated. C, Jur4 cells were either left untreated or pretreated with increasing concentrations of EGTA-AM (50 and 100 μm) for 30 min prior to a stimulation with PMA, PMA + ionomycin, or TNF-α (10 ng/ml). After 6 h, the cells were lysed, and the luciferase activity was determined. Experiments were done in duplicate, and the mean value and the S.E. (error bars) are depicted. D, Jurkat T cells were either left untreated or pretreated with 100 μm EGTA-AM for 30 min prior to the stimulation with PMA + ionomycin. Whole cell extracts were prepared and subjected to an anti-Bcl10 immunoprecipitation (IP). 50 μg of the samples were probed in control Western blot analyses with antibodies specifically recognizing IκBα or Carma1.
FIGURE 3.
FIGURE 3.
Negative effect of cyclosporin A and FK506 on TCR-induced NF-κB activity and CBM complex formation. A, Jur4 cells were pretreated with CsA (200 ng/ml, 1 h) and stimulated with P+I, PMA, or ionomycin (6 h) prior to estimation of luciferase activity. The mean value and S.E. (error bars) of two independently performed experiments are depicted. B, EMSA experiments using NF-κB- or Oct-specific probes in combination with whole cell extracts from untreated, CsA-pretreated (200 ng/ml), or P+I-stimulated Jurkat T cells (top). The same extracts were used for immunoblot analyses (IB) with antibodies recognizing IκBα, phospho-p65 (Ser536), and ERK2 (bottom). C, the IKK complex was immunopurified from Jurkat T cells pretreated with CsA or FK506 prior to P+I stimulation using an anti-NEMO antibody, and the kinase activity (KA) was estimated. Phosphorylation was determined by autoradiography. IκBα degradation was determined by an additional immunoblot. D, anti-Bcl10 immunoprecipitation analysis (IP) (top) of whole cell extracts from Jurkat T cells pretreated with CsA (200 ng/ml) for 1 h. Selected samples were additionally stimulated with P+I as indicated. A fraction of the whole cell extracts (50 μg/sample) was subjected to control immunoblot analyses (bottom). E, a similar anti-Bcl10 immunoprecipitation analysis as described in D was performed using primary murine T cells. F, Jurkat T cells were pretreated with CsA (200 ng/ml) or EGTA-AM (100 μm) for 1 h prior to the stimulation with agonistic anti-CD3 (1 μg/ml, plate-bound) and anti-CD28 (5 μg/ml, soluble). Subsequently, an anti-Bcl10 immunoprecipitation analysis was performed (top). To monitor the cellular expression levels of the analyzed proteins, additional immunoblot analyses were performed (bottom).
FIGURE 4.
FIGURE 4.
Analysis of the CsA effect on different signaling pathways. A, Jurkat T cells were either left untreated or pretreated with CsA (200 ng/ml) prior to stimulation with PMA + ionomycin. Resulting whole cell extracts were subjected to immunoblot analysis (IB) with the indicated phospho-specific antibodies to monitor the activation of PKC proteins, especially PKCϴ and PKCα, and phospho-IκBα. B, to monitor the activation status of CaMKII, cytoplasmic extracts also used in Fig. 3B were analyzed with anti-phospho-CaMKII and anti-CaMKII antibodies. C, cytoplasmic extracts from Jurkat T cells either left untreated or pretreated with CsA for 30 min prior to P+I stimulation were analyzed with the phospho-p65-specific antibody.
FIGURE 5.
FIGURE 5.
siRNA-mediated suppression of CnAα and CnAβ attenuates P+I-induced NF-κB activity. A, anti-Bcl10 immunoprecipitation analyses (IP) were performed using whole cell extracts from untreated or P+I-stimulated Jurkat T cells that were transfected with different siRNAs. Control immunoblot analyses (IB) were performed to determine the cellular levels of the indicated proteins. Two independent experiments were used for the quantification of the relative P+I-induced Carma1-Bcl10 interaction (bottom). Calculation was performed on the basis of the signal intensity measured by densitometry. B, Jurkat T cells transfected with the indicated siRNA were either left untreated or stimulated with PMA + ionomycin. Resulting whole cell extracts were subjected to EMSA experiments using NF-κB- or Oct-specific probes (top). To monitor the siRNA-mediated knockdown of CnA isoforms, additional immunoblot analyses were performed using the indicated antibodies (bottom). n.s., nonspecific. Relative NF-κB binding activity was determined by normalizing the background subtracted signals of the NF-κB-specific bands to the intensity of the Oct-specific signals. C, to estimate the functionality of the siRNA-mediated suppression of CnA isoforms, the IL2 expression in untreated or P+I-stimulated (8 h) Jurkat cells, which were transfected with the stated siRNAs, was determined by quantitative PCR analysis (top). All samples were measured in triplicate and normalized for β-actin expression. Protein extractions of transfected cells were done in parallel, and control immunoblots were performed with the indicated antibodies (bottom). Error bars, S.E.
FIGURE 6.
FIGURE 6.
Altered phosphorylation status of Bcl10 upon EGTA-AM and CsA treatment in P+I-stimulated Jurkat T cells. Bcl10 or Carma1 proteins were immunoprecipitated (IP) using whole cell extracts from radiolabeled Jurkat T cells (100 μCi/ml [32P]orthophosphate, 6 h). Cells were either left untreated or treated with CsA (200 ng/ml) or EGTA-AM (100 μm) during the last 1 h of radiolabeling prior to a PMA + ionomycin stimulation for 10 min (lanes 4–6). IB, immunoblot.
FIGURE 7.
FIGURE 7.
Calcineurin affects the phosphorylation status but not the stability of Bcl10 in HEK293 cells. A, immunoblot analyses using whole cell extracts from transiently transfected HEK293 cells with antibodies recognizing IKK2 (top), calcineurin A (middle), or Bcl10 (bottom). B, FLAG-Bcl10 was ectopically expressed in HEK293 cells either alone or in conjunction with HA-ΔCamWT, a catalytically inactive ΔCam mutant (ΔCamH151Q) or Xpress-IKK2, as indicated. Transfected cells were radiolabeled (100 μCi/ml [32P]orthophosphate, 2 h), and resulting whole cell extracts were subjected to anti-FLAG immunoprecipitation experiment. Phosphorylation was determined by autoradiography following an anti-Bcl10 immunoblot to ensure the successful precipitation. C, FLAG-Bcl10 was immunoprecipitated (IP) from transiently transfected HEK293 cells, and immunocomplexes were incubated at 37 °C for 1 h with shrimp alkaline phosphatase (SAP; 1 unit, lanes 1–4). Subsequently, the immunocomplexes were subjected to anti-Bcl10 immunoblot analysis (IB). Expression levels of the FLAG-Bcl10 (top, lanes 13–16), HA-ΔCam (middle), or Xpress-IKK2 (bottom) were determined by immunoblot analyses. D, Jurkat T cells were transiently transfected with expression vectors for FLAG-Bcl10WT, FLAG-Bcl10S5A, and FLAG-ΔCam, as indicated. The cells were either left untreated or were stimulated with P+I for 3 h prior to immunoblot analysis with the indicated antibodies. E, HEK293 cells transiently transfected with expression vectors for FLAG-Bcl10, HA-ΔCam, or Xpress-IKK2 were either left untreated or treated with cycloheximide (50 ng/ml) for different times prior to immunoblot analyses with antibodies for Bcl01, IKK2, or HA epitope. As a positive control for cycloheximide efficacy, c-Myc levels were analyzed.
FIGURE 8.
FIGURE 8.
Calcineurin is a Bcl10 phosphatase in vitro. For the in vitro phosphatase assay, bacterial expressed GST-Bcl10 fusion protein was coupled to GSH-agarose prior to a kinase assay with FLAG-IKK2. The phosphorylated GST-Bcl10 proteins were subsequently washed twice with TNT buffer and once with phosphatase reaction buffer. The purified phosphorylated GST-Bcl10 protein was then subjected to an in vitro phosphatase assay by adding either recombinant calmodulin alone (150 units/sample, lanes 1 and 2) or in conjunction with increasing amounts of recombinant calcineurin A-calcineurin B (lanes 3–6). The samples were separated by SDS-PAGE and transferred to nitrocellulose membrane, and the resulting membrane was subsequently exposed to x-ray films to determine the phosphorylation status of Bcl10 (32P). To control for equal GST-Bcl10 loading, the membrane was additionally subjected to an anti-Bcl10 immunoblot analysis (IB) (bottom).
FIGURE 9.
FIGURE 9.
Calcineurin A interacts with the components of the CBM complex. A–C, to determine whether calcineurin A interacts with the CBM complex anti-FLAG immunoprecipitations (IP) were performed with the whole cell extracts from transiently transfected HEK293 cells, and interaction of Carma1 (A), Malt1 (B), or Bcl10 (C) with the different CnA proteins was monitored with the appropriate antibodies (top). To ensure the expression of the ectopically expressed proteins, a fraction of the whole cell extracts (10%) was analyzed by additional immunoblot experiments (IB) (bottom). *, IgH. D, analysis of the calcineurin interaction with the CBM complex in Jurkat T cells. Immunoprecipitation experiments (500 μg/sample) were performed with an anti-Malt1 antibody, and immunoblot analyses (40 μg/sample, lanes 1–4) used whole cell extracts from untreated or P+I-stimulated Jurkat T cells. NRS, normal rabbit serum.
FIGURE 10.
FIGURE 10.
Hypothetical model of the calcineurin effect on CBM complex assembly. In resting T cells, Carma1 is hypophosphorylated and Bcl10, included in a heterodimer with Malt1, displays a low basal phosphorylation (gray boxes). Furthermore, calcineurin and PKCϴ activity remains low in unstimulated T cells. Engagement of T cell receptor, however, induces PLCγ1-dependent Ca2+ influx and diacylglycerol (DAG)-mediated PKCϴ activation (white box, center). Activated PKCQ phosphorylates Carma1, and activated calcineurin dephosphorylates Bcl10. Hypophosphorylated Bcl10 and phospho-Carma1 are a prerequisite for the efficient formation of the CBM complex. As a negative feedback mechanism, Bcl10 gets rephosphorylated or even hyperphosphorylated, for example by IKK2 or by CaMKII. The CBM complex becomes inactive, and Bcl10 is subsequently degraded.

Similar articles

Cited by

References

    1. Oh-hora M., Rao A. (2008) Curr. Opin. Immunol. 20, 250–258 - PMC - PubMed
    1. Werlen G., Jacinto E., Xia Y., Karin M. (1998) EMBO J. 17, 3101–3111 - PMC - PubMed
    1. Marienfeld R., Neumann M., Chuvpilo S., Escher C., Kneitz B., Avots A., Schimpl A., Serfling E. (1997) Eur. J. Immunol. 27, 1601–1609 - PubMed
    1. Trushin S. A., Pennington K. N., Algeciras-Schimnich A., Paya C. V. (1999) J. Biol. Chem. 274, 22923–22931 - PubMed
    1. Thome M., Weil R. (2007) Trends Immunol. 28, 281–288 - PubMed

Publication types

MeSH terms