. 2011 Mar 25;286(12):10581-92.
doi: 10.1074/jbc.M110.187450. Epub 2011 Jan 3.

Single particle tracking confirms that multivalent Tat protein transduction domain-induced heparan sulfate proteoglycan cross-linkage activates Rac1 for internalization

Affiliations

Single particle tracking confirms that multivalent Tat protein transduction domain-induced heparan sulfate proteoglycan cross-linkage activates Rac1 for internalization

Junji Imamura et al. J Biol Chem. .

Abstract

The mechanism by which HIV-1-Tat protein transduction domain (TatP) enters the cell remains unclear because of an insufficient understanding of the initial kinetics of peptide entry. Here, we report the successful visualization and tracking of TatP molecular kinetics on the cell surface with 7-nm spatial precision using quantum dots. Strong cell binding was only observed with a TatP valence of ≥8, whereas monovalent TatP binding was negligible. The requirement of the cell-surface heparan sulfate (HS) chains of HS proteoglycans (HSPGs) for TatP binding and intracellular transport was demonstrated by the enzymatic removal of HS and simultaneous observation of two individual particles. Multivalent TatP induces HSPG cross-linking, recruiting activated Rac1 to adjacent lipid rafts and thereby enhancing the recruitment of TatP/HSPG to actin-associated microdomains and its internalization by macropinocytosis. These findings clarify the initial binding mechanism of TatP to the cell surface and demonstrate the importance of TatP valence for strong surface binding and signal transduction. Our data also shed light on the ability of TatP to exploit the machinery of living cells, using HSPG signaling to activate Rac1 and alter TatP mobility and internalization. This work should guide the future design of TatP-based peptides as therapeutic nanocarriers with efficient transduction.


Figures

FIGURE 1.
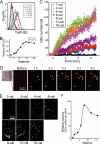
FIGURE 1.
Cell-surface binding of monovalent TatP. A, spatial precision of TatP-QDs in HeLa. Immobile TatP-QDs were tracked in HeLa. The S.D. of the position of QDs was 6.9 nm in the x axis and 6.5 nm in the y axis. B, typical time course of monovalent TatP-QD cell binding to HeLa cells pre-exposed to 30 pm of monovalent Tat-QDs, followed by exposure to the indicated concentrations of nonlabeled TatP or medium. Data were collected at 400 ms/frame. Arrow indicates time of TatP addition. C, HeLa were exposed to either FITC-TatP, FITC alone (control) (upper panel), 1- and 4-val TatP-Alexa488, or Alexa488 alone (lower panel) for 15 min and analyzed for their binding capability by FACS. D, schematic figure illustrates the experiments for E–G: monovalent TatP-QD contains free sites for biotin-TatP on the Sts. E and D, typical time course of TatP-QD cell binding (E) and selected frames (F) from HeLa cells pre-exposed to 30 pm monovalent Tat-QDs, followed by exposure to the indicated concentrations of biotin-TatP. Arrows in E and F (right panel) indicate the time of biotin-TatP addition. Bars, 5 μm. F, arrowheads (left panel) indicate filopodia. G, mean QD number/cell calculated from ∼20 cells exposed to biotin-TatP for 15 min. Bars, S.D. Results are representative of three independent experiments.
FIGURE 2.
FIGURE 2.
Cell-surface binding of multivalent TatP. A and B, analysis of cell-bound TatP of different valences in HeLa by FACS (A) and calculated relative MFI (B). Cells were exposed to TatP-QDs of the indicated valence or QDs alone (cont) for 15 min; binding levels were analyzed by FACS. C and D, typical time course of cell binding for TatP-QD of different valences to HeLa cells (C); images at 15 min of TatP exposure (E), and selected images of the first 5 s of 8-Val TatP cell exposure (D). The cells were exposed to TatP-QDs of the indicated valence or medium, and images were collected at 400 ms/frame. Lines, trajectories of the QDs. (See also supplemental Video 1.) F, binding velocities calculated from time course experiments in C. Results are representative of five independent experiments.
FIGURE 3.
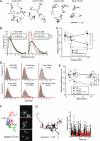
FIGURE 3.
Multivalent TatP induces a slowing of diffusion by frequent recruitment of TatR to actin-associated membrane lipid rafts. A, typical trajectories of 2- or 8-val TatP after 2 and 15 min of exposure, recorded at 23 ms/frame. (See supplemental Videos 2 and 3.) B, histograms of 2- and 8-val-TatP velocities (calculated from 1150-ms time window) in the presence or absence of 100 μm Rac1 inhibitor after 5 min (left) and 15 min (right) of exposure. C, mean diffusion coefficient of 2- or 8-val TatP, over time up to 15 min, averaged for all particles in time window 1150 ms. Mean diffusion coefficient of 8-val TatP on cells, when unbound QDs were washed out after 2 min of exposure (8-val washed out). Bars, S.E. D, intensity histogram of TatP-QDs at the indicated time and condition, fitted to four gaussian curves. The mean of the first peak is equal to TatP-QD (left upper panel), defined as q1. E, mean diffusion coefficient of 8-val TatP in the presence and absence of 50 nm LatB, 100 μm Rac1 inhibitor (RacI), and 4 mm MBC. Bars, S.E. F, selected frames (left) and trajectories of 8-val TatP-QDs from 23 ms/frame after a 15-min exposure. Arrowhead color corresponds to that of its trajectory. (See supplemental Video 4.) G, often 8-val TatP exhibited alternating periods of apparently simple Brownian diffusion (black) and temporary immobilization (red) for 500 frames (left). Changes in velocity of the trajectories over time are also shown (right). The numbers of temporal immobilizations of the trajectories correspond with the graph. (See also supplemental Video 5.) *, p < 1 × 10⁻⁵; **, p < 1 × 10⁻⁷; ***, p < 1 × 10⁻¹⁵ as calculated by Student's t test.
FIGURE 4.
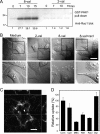
FIGURE 4.
Activation of Rac1 by 8-val-TatP exposure linked to membrane ruffling and TatP internalization by macropinocytosis. A, levels of activated Rac1 after 8-val or 2-val TatP-QD exposure. HeLa cells, 24-h serum-starved, were exposed to 30 pm 8-val or 2-val TatP-QDs for the indicated times and lysed. Lysates were harvested, and Pak1 pulldown was performed. Samples from pulldowns were loaded and blotted with anti-Rac1. The numbers indicate the level of Rac1 activation. B, DIC images of HeLa cells at 15 min after 8-val TatP in the presence and absence of 100 μm Rac1 inhibitor, NCS23766 (upper panel). Higher magnitude images in upper panel squares are shown in lower panels. HeLa cells, 24-h serum-starved, were cultured with/without 100 μm Rac1 inhibitor (RacI) and exposed to 100 pm 8-val-TatP-QDs, and DIC images were collected every 10 s. A 2-val TatP QD stimulation is shown as a control. Arrowheads indicate prominent membrane ruffling. Bar, 20 μm. (See also supplemental Videos 6 and 7.) C, three-dimensional reconstructed images of a HeLa cell exposed to 100 pm 8-val TatP for 1 h. Arrowheads indicate TatP containing macropinosomes. Bar, 10 μm. D, effects of 50 nm cytochalasin D (CyD), 4 mm MBC, 1 mm amiloride (AMI), 100 μm Rac1 inhibitor (RacI), and 17 μm Dynasore (Dyn). Cells were exposed to the indicated drugs and exposed to 100 pm 8-val TatP for 1.5 h; images were collected by LSM510 confocal microscope at ∼2 μm above the glass surface, which can identify cytoplasm. Uptake levels were calculated based on 20 observed cells. Bars, S.D. Results in B–D are representative of five independent experiments.
FIGURE 5.
FIGURE 5.
HSPGs are essential for initial TatP cell-surface binding. A, typical time course of monovalent TatP-QD cell binding to HeLa cells treated with 20 milliunits of HS lyase or 0.5 units of Ch-ABC lyase or cultured with 10 units of heparin. Images were collected at 400 ms/frame. B, binding of a mAb specific for intact HSPGs (F58-10E4) or for an epitope generated by the cleavage of HSPGs with HS lyase (F69-3G10). Cells were treated with 20 milliunits of HS lyase (middle right panel), 0.5 units of Ch-ABC lyase (middle left panel), or 0.5% trypsin/EDTA (right panel); nontreated cells (left panels) were stained with the indicated Abs and analyzed by FACS. Dark lines represent anti-HSPG Abs; light lines represent isotype-control. C, turnover of HSPG (F58-10E4) in cells treated with 0.5% trypsin/EDTA by FACS. D, recovery of the cell-surface binding capability of 8-val TatP-QDs in cells treated with 0.5% trypsin/EDTA. Data were calculated from the MFI values by FACS. E, recovery of the cell-surface binding capability of 8-val TatP calculated from single particle images of 8-val-TatP binding in cells treated with 0.5% trypsin/EDTA. The relative binding capability of 8-val TatP over time was calculated from the mean numbers of TatPs/cell based on 20 observed cells (upper graph) and selected images (lower panels). Bars, S.D. Results are representative of three independent experiments.
FIGURE 6.
FIGURE 6.
Co-mobilization and co-internalization of TatP and HSPG. A, bright field image (upper panel) and fluorescence images in the red square were obtained using dual imaging system (lower panel) at 200 ms/frame. Fluorescence images of TatP-QD525 (lower left panel) and HSPG as detected by F58-10E4 plus secondary Ab labeled with QD705 (lower right panel) at 20 min of TatP exposure. Arrowheads indicate co-localization spots of TatP and HSPG. Bars, 5 μm. B, time course fluorescence images of TatP and HSPG of the red arrow in A. (See also supplemental Video 8.) C, bright field image (upper) and selected frames of merged fluorescence images of TatP (green) and HSPG (red) at 45 min of TatP exposure. Arrowheads indicate co-localization of TatP and HSPG. Images are contrast-enhanced. Bar, 1 μm.
FIGURE 7.
FIGURE 7.
Levels of HSPG expression and TatP-binding capability in various cell lines. A, HSPG (as detected by F58-10E4) expression in HeLa, HepG2, and HOS by FACS. B, levels of 8-val TatP-QDs bound in HeLa, HepG2, and HOS as examined by FACS. C, relative mean number of 8-val TatPs/cell on different cells at 15 min of TatP exposure as observed by single molecule microscopy. Data are based on 20 observed cells. Bars, S.D.
FIGURE 8.
FIGURE 8.
A model showing the events in plasma membrane exposed to 2-val and 8-val TatP. HSPG exists as a monomer; 8-val TatP clusters with several HSPGs, leading to recruitment of Rac1 to lipid rafts, which triggers membrane reorganization of actin filaments and/or actin-dependent domains and induces the temporary immobilization and clustering of 8-val TatP/HSPGs. Rac1 activation induces TatP/HSPG internalization through macropinocytosis.

Similar articles

Cited by

References

    1. Frankel A. D., Pabo C. O. (1988) Cell 55, 1189–1193 - PubMed
    1. Green M., Loewenstein P. M. (1988) Cell 55, 1179–1188 - PubMed
    1. Chauhan A., Tikoo A., Kapur A. K., Singh M. (2007) J. Control Release 117, 148–162 - PMC - PubMed
    1. Fawell S., Seery J., Daikh Y., Moore C., Chen L. L., Pepinsky B., Barsoum J. (1994) Proc. Natl. Acad. Sci. U.S.A. 91, 664–668 - PMC - PubMed
    1. Vivès E., Brodin P., Lebleu B. (1997) J. Biol. Chem. 272, 16010–16017 - PubMed

Publication types

MeSH terms

Substances