. 2011 Mar;55(3):1053-62.
doi: 10.1128/AAC.01002-10. Epub 2011 Jan 3.

Nonthermal dielectric-barrier discharge plasma-induced inactivation involves oxidative DNA damage and membrane lipid peroxidation in Escherichia coli

Affiliations

Nonthermal dielectric-barrier discharge plasma-induced inactivation involves oxidative DNA damage and membrane lipid peroxidation in Escherichia coli

Suresh G Joshi et al. Antimicrob Agents Chemother. 2011 Mar.

Abstract

Oxidative stress leads to membrane lipid peroxidation, which yields products causing variable degrees of detrimental oxidative modifications in cells. Reactive oxygen species (ROS) are the key regulators in this process and induce lipid peroxidation in Escherichia coli. Application of nonthermal (cold) plasma is increasingly used for inactivation of surface contaminants. Recently, we reported a successful application of nonthermal plasma, using a floating-electrode dielectric-barrier discharge (FE-DBD) technique for rapid inactivation of bacterial contaminants in normal atmospheric air (S. G. Joshi et al., Am. J. Infect. Control 38:293-301, 2010). In the present report, we demonstrate that FE-DBD plasma-mediated inactivation involves membrane lipid peroxidation in E. coli. Dose-dependent ROS, such as singlet oxygen and hydrogen peroxide-like species generated during plasma-induced oxidative stress, were responsible for membrane lipid peroxidation, and ROS scavengers, such as α-tocopherol (vitamin E), were able to significantly inhibit the extent of lipid peroxidation and oxidative DNA damage. These findings indicate that this is a major mechanism involved in FE-DBD plasma-mediated inactivation of bacteria.


Figures

FIG. 1.
FIG. 1.
Colony count assay, the gold standard in bacteriology, shows that plasma inactivates E. coli rapidly upon exposure (at 7 log10), and the antimicrobial effect is plasma dose (energy) dependent (A) and bacterial cell density dependent (B). In panel B, the bar labeled 9* shows the percentage of surviving cells in cells not treated with plasma treatment (for 9 log10). The values are means ± standard deviations (SDs) (error bars) for 3 separate experiments.
FIG. 2.
FIG. 2.
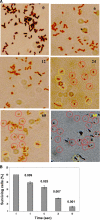
(A) Representative images showing the appearance of morphological changes peculiar to the Gram-staining response and E. coli cells upon increasing moderate plasma (500-Hz) exposure over time. The Gram-staining property of E. coli cells changes over time upon plasma exposure, indicative of membrane-associated and/or cytoplasmic pH changes, and the cells lose their stain-retaining property. This indicates chemical and/or physical changes in the cells (including the membrane), one of the features of oxidative changes. Cells shrink to reduce surface area and tend to become coccoid (black-and-white image in the left bottom corner of panel A has increased contrast to show the changes). The yellow and red circles show the healthy bacillary cells and damaged cells with coccoid/spherical appearance, respectively. Bright-field microscopy was done at a magnification of ×1,000. The numbers in the top right corners of the images in panel A show the time (in seconds) of exposure to plasma. (B) The XTT assay for E. coli (8 log10) was performed to determine whether the cells die in a dose-dependent manner or whether the cells are still respiring or are dormant. The treatment time (in seconds) is displayed on the x axis, and P values were calculated for the values compared to the values for the untreated condition (0 s). Unlike the colony assay, the XTT assay gives instant results for their survival status. The numbers above the bars indicate the P values comparing the values to the values for nontreated cells (0 s). Error bars shows the SDs.
FIG. 3.
FIG. 3.
Colony assays demonstrating the effects of antioxidants on E. coli survival during plasma treatment. (A) Effects of antioxidants on E. coli survival during plasma treatment in the presence of antioxidants (in PBS). The plasma settings were 500 Hz (3.12 J/cm2) for 24 s. The control was not treated with plasma. All other bars show 24 s of exposure in PBS or PBS with antioxidant. The numbers above the bars and preceded by an asterisk are the P values comparing the value to the value for plasma treatment (in PBS) without antioxidant (n = 3). (B) Exposure to antioxidants after plasma treatment does not protect E. coli cells from death, and the results show that plasma causes severe and nonrepairable damage to bacterial cells. The settings and parameters are the same as in panel A.
FIG. 4.
FIG. 4.
Plasma treatment generates detectable amounts of reactive oxygen species (ROS). (A and B) Generation of singlet oxygen (1O2)-like ROS upon exposure to plasma treatments, as detected by specific fluorescence from molecular probes. (A to D) Plasma treatments produced ROS in both the medium (PBS) (A and C) and the E. coli cells (B and D). The plasma treatment time (in seconds) and the corresponding amount of energy (in J/cm2) are shown on the x axes. Arbitrary fluorescence units (AFU), an indicator of the corresponding ROS, are shown on the y axes. (For details, see Materials and Methods.) (C) The generation of hydrogen peroxide (H2O2)-like species upon exposure to plasma treatments is detected using a specific fluorescence molecular probe, and catalase-mediated scavenging is observed. Plasma exposure produced hydrogen peroxide in both the medium (PBS) (C) and the E. coli cells (D). Cat, catalase. (E) A colony assay demonstrating catalase-mediated protection to E. coli during plasma treatment is shown. The numbers above the bars and preceded by an asterisk are P values comparing the value with either the value for the corresponding untreated sample (A and B) or the relevant corresponding condition (with catalase or without catalase) (C and D). A statistically nonsignificant but appreciable amount of protection by catalase was seen in panel E. The values are means ± SDs (error bars) for 3 experiments.
FIG. 5.
FIG. 5.
Plasma-induced stress attacks the membrane and leads to the loss of membrane potential in E. coli cells in a dose-dependent manner. (A) A fluorescence molecular probe [DiSBAC2(3)] detects any membrane damage which leads to compromise in membrane integrity and thus membrane potential. The plasma treatment time (in seconds) and the corresponding amount of energy (in J/cm2) are shown on the x axis. An increase in arbitrary fluorescence unit (AFU) is taken as an indicator of a drop in membrane potential and is shown on the y axis. Values are means ± SDs (error bars). The numbers above the bars are P values. The P values preceded by one asterisk compare the value to the value for nontreated control. The P value preceded by two asterisks compare that value to the value for the corresponding treatment without antioxidant (vitamin E [VitE]). (B) A BacLight viability test essentially tests the compromised and leaky cell membrane in E. coli, and thus propidium iodide (PI) stain is taken up by membrane-damaged cells where it interacts with cellular DNA. These PI-positive cells are often taken as an indicator for dying or dead cells. The yellow numbers in the top right corners of the images are the amount of energy of the plasma treatment (in J/cm2).
FIG. 6.
FIG. 6.
The malondialdehyde (MDA) assay shows that plasma treatment leads to lipid peroxidation in E. coli. (A and B) Both an isolated membrane-rich fraction of E. coli (A) and intact E. coli cells (B) show a dose-dependent generation of MDA, the lipid peroxidation product. This peroxidation is inhibited by the antioxidant α-tocopherol (a form of vitamin E [VitE]), suggesting the involvement of oxidative stress-mediated damage. The values are means ± SDs (error bars) for 3 experiments. The numbers above the bars followed by one asterisk are P values comparing the value to the value for the untreated control. The numbers followed by two asterisks are P values comparing the value to the value for the corresponding plasma treatment condition without vitamin E.
FIG. 7.
FIG. 7.
The oxidative DNA damage marker 8-hydroxydeoxyguanosine (8-OHdG) appears as the oxidative stress increases. (A) A graph showing detection of 8-OHdG with serially diluted solutions of 8-OHdG by ELISA technique. This standard curve was used for comparison with experimental conditions. (B) Plasma dose (energy)-dependent response showing increasing appearance of 8-OHdG, which was is inhibited significantly upon pretreatment and the treatment in the presence of an antioxidant, vitamin E (VitE). Error bars show SDs. The number above the bar followed by one asterisk is the P value comparing the value to the value for the untreated control. The number followed by two asterisks is the P value comparing the value to the value for corresponding plasma condition without antioxidant (VitE). (C) The ethidium bromide-stained agarose gel, showing fragmentation of genomic DNA of E. coli cells as the amount of plasma energy application increases. The length of time of plasma treatment of the cells (in seconds) and corresponding energy of plasma treatment (in J/cm2) are shown above the gel.

Similar articles

Cited by

References

    1. Baron, E. J., S. Mix, and W. Moradi. 2010. Clinical utility of an automated instrument for Gram staining single slides. J. Clin. Microbiol. 48:2014-2015. - PMC - PubMed
    1. Cerutti, P. A. 1985. Prooxidant states and tumor promotion. Science 227:375-381. - PubMed
    1. Flors, C., et al. 2006. Imaging the production of singlet oxygen in vivo using a new fluorescent sensor, Singlet Oxygen Sensor Green. J. Exp. Bot. 57:1725-1734. - PubMed
    1. Flors, C., and S. Nonell. 2006. Light and singlet oxygen in plant defense against pathogens: phototoxic phenalenone phytoalexins. Acc. Chem. Res. 39:293-300. - PubMed
    1. Fridman, A. 2008. Plasma chemistry. Cambridge University Press, New York, NY.

Publication types