. 2011 Jan 11;108(2):662-7.
doi: 10.1073/pnas.1014743108. Epub 2011 Jan 3.

Patterns of widespread decline in North American bumble bees

Affiliations

Patterns of widespread decline in North American bumble bees

Sydney A Cameron et al. Proc Natl Acad Sci U S A. .

Abstract

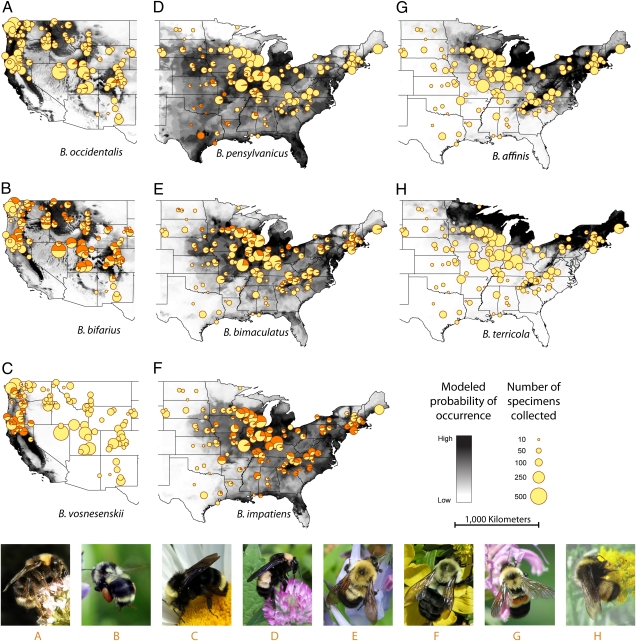
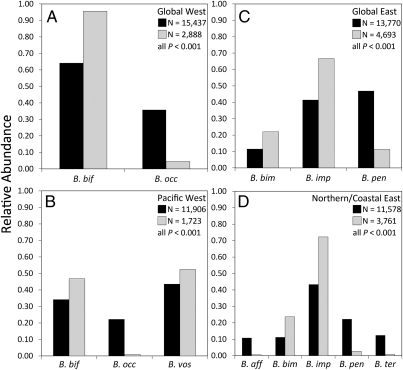
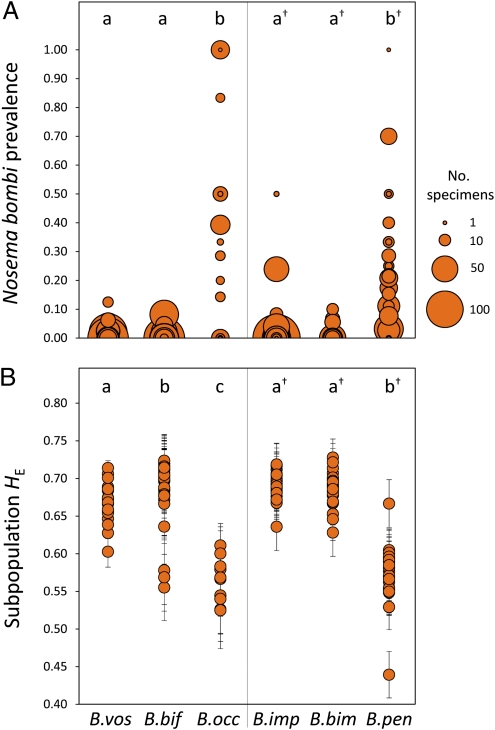
Bumble bees (Bombus) are vitally important pollinators of wild plants and agricultural crops worldwide. Fragmentary observations, however, have suggested population declines in several North American species. Despite rising concern over these observations in the United States, highlighted in a recent National Academy of Sciences report, a national assessment of the geographic scope and possible causal factors of bumble bee decline is lacking. Here, we report results of a 3-y interdisciplinary study of changing distributions, population genetic structure, and levels of pathogen infection in bumble bee populations across the United States. We compare current and historical distributions of eight species, compiling a database of >73,000 museum records for comparison with data from intensive nationwide surveys of >16,000 specimens. We show that the relative abundances of four species have declined by up to 96% and that their surveyed geographic ranges have contracted by 23-87%, some within the last 20 y. We also show that declining populations have significantly higher infection levels of the microsporidian pathogen Nosema bombi and lower genetic diversity compared with co-occurring populations of the stable (nondeclining) species. Higher pathogen prevalence and reduced genetic diversity are, thus, realistic predictors of these alarming patterns of decline in North America, although cause and effect remain uncertain.


Conflict of interest statement

The authors declare no conflict of interest.

Figures

Fig. 1.
Fig. 1.
Summary of Bombus individuals surveyed from 382 collection locations for eight target species, including historical range maps (grayscale shading) with current sightings (pie charts) and associated photographs of hypothesized declining western B. occidentalis (A) and eastern B. pensylvanicus (D), B. affinis (G), and B. terricola (H); stable species are represented by the western B. bifarius (B) and B. vosnesenskii (C), and the eastern B. bimaculatus (E), and B. impatiens (F). Sizes of the pie charts indicate total number of individuals surveyed at each location; size of the orange segment indicates the fraction of the respective target species collected at that site (some locations are pooled across sites for visual clarity; for detailed data, refer to Table S1). Underlying grayscale shading represents the modeled distribution of each target species from unique presence localities obtained from natural history collections (SI Methods, Statistical Niche Models). Photograph A (B. occidentalis) taken by D. Ditchburn, B (B. bifarius) by L. Solter, C (B. vosnesenskii) by M. Layne, D (B. pensylvanicus) by T. Wilson, E (B. bimaculatus) by J. Whitfield, F (B. impatiens) by J. Lucier, G (B. affinis) by J. James-Heinz, and H (B. terricola) by J. Whitfield.
Fig. 2.
Fig. 2.
Four regional comparisons of pooled historical (1900–1999; black bars) and current relative abundances (2007–2009; gray bars) for six North American bumble bee species using z tests of equal proportions. Methods has a description of the four following geographic regions used in comparisons of relative abundance. (A) Global west, AZ, CA, CO, ID, MT, NM, NV, OR, SD, UT, WA, and WY; B. bifarius: z = −61.71, P < 0.001; B. occidentalis: z = 61.71, P < 0.001. (B) Pacific west, CA, OR, and WA; B. bifarius: z = −15.09, P < 0.001; B. occidentalis: z = 56.26, P < 0.001; B. vosnesenskii: z = 10.40, P < 0.001. (C) Global east, AL, AR, CO, CT, GA, IL, IN, IA, KS, KY, LA, ME, MA, MN, MS, MO, NE, NY, NC, ND, OH, OK, PA, SC, SD, TN, TX, VA, and WI; B. bimaculatus: z = −15.70, P < 0.001; B. impatiens: z = −31.27, P < 0.001; B. pensylvanicus: z = −56.57, P < 0.001. (D) Northern/coastal east, CT, GA, IL, IN, IA, ME, MA, MN, NY, NC, OH, PA, TN, VT, VA, and WI; B. affinis: z = 35.57, P < 0.001; B. bimaculatus: z = −18.40, P < 0.001; B. impatiens: z = −37.19, P < 0.001; B. pensylvanicus: z = 46.01, P < 0.001; B. terricola: z = 38.40, P < 0.001. All have df = 1.
Fig. 3.
Fig. 3.
Nosema bombi infection prevalence (A) and microsatellite gene diversity (B). Average N. bombi prevalence (A) for B. vosnesenskii was 1.33% across all sites (n = 903, detected at 10 of 28 sites); B. bifarius was 0.57% (n = 2096, 7 of 88 sites); B. occidentalis was 37.2% (n = 172, 18 of 39 sites); B. impatiens was 0.73% (n = 2864; 10 of 131 sites); B. bimaculatus was 0.28% (n = 1070, three of 95 sites); and B. pensylvanicus was 15.2% (n = 545; 29 of 64 sites). Each circle represents a collecting site; its size indicates the number of individuals screened. Letters above each species plot indicate pairs with significantly different prevalence (P < 0.001) assessed by binomial GLMs (Table S6). (B) Average HE (± SE) per subpopulation. Letters indicate species pairs with significantly different HE (P = 0.001) as determined by 1,000 subpopulation permutations. In both A and B, statistical comparisons were conducted separately for western (no ) and eastern () species.

References

    1. Hegland SJ, Totland O. Is the magnitude of pollen limitation in a plant community affected by pollinator visitation and plant species specialization levels? Oikos. 2008;117:883–891.
    1. Fontaine C, Dajoz I, Meriguet J, Loreau M. Functional diversity of plant-pollinator interaction webs enhances the persistence of plant communities. PLoS Biol. 2006;4:e1. - PMC - PubMed
    1. Memmott J, Waser NM, Price MV. Tolerance of pollination networks to species extinctions. Proc Biol Sci. 2004;271:2605–2611. - PMC - PubMed
    1. Corbet SA, Williams IH, Osborne JL. Bees and the pollination of crops and flowers in the European Community. Bee World. 1991;72:47–59.
    1. Kremen C, Williams NM, Thorp RW. Crop pollination from native bees at risk from agricultural intensification. Proc Natl Acad Sci USA. 2002;99:16812–16816. - PMC - PubMed

Publication types

LinkOut - more resources