. 2011 Jan 18;108(3):1188-93.
doi: 10.1073/pnas.1004765108. Epub 2011 Jan 3.

Recovering sound sources from embedded repetition

Affiliations

Recovering sound sources from embedded repetition

Josh H McDermott et al. Proc Natl Acad Sci U S A. .

Abstract

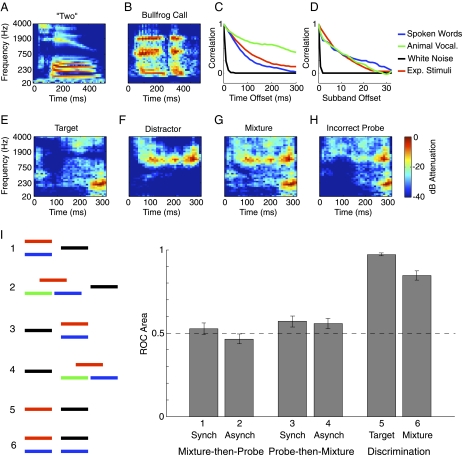
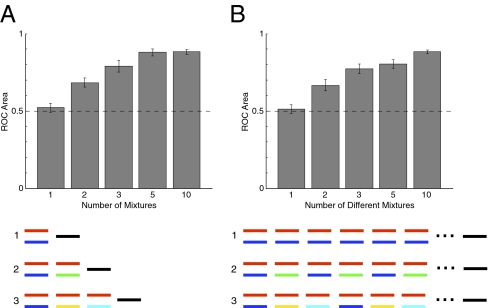
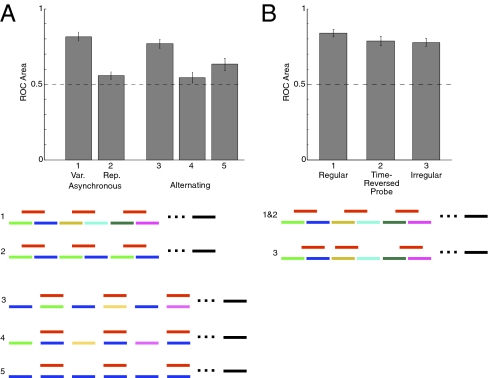
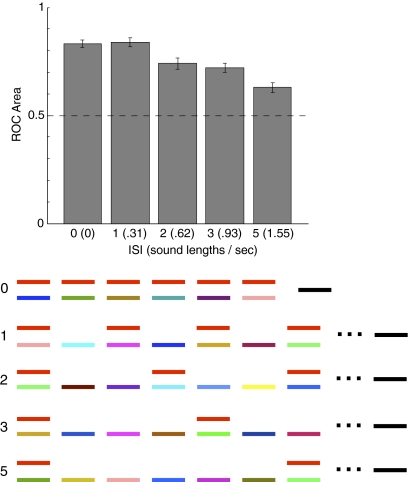
Cocktail parties and other natural auditory environments present organisms with mixtures of sounds. Segregating individual sound sources is thought to require prior knowledge of source properties, yet these presumably cannot be learned unless the sources are segregated first. Here we show that the auditory system can bootstrap its way around this problem by identifying sound sources as repeating patterns embedded in the acoustic input. Due to the presence of competing sounds, source repetition is not explicit in the input to the ear, but it produces temporal regularities that listeners detect and use for segregation. We used a simple generative model to synthesize novel sounds with naturalistic properties. We found that such sounds could be segregated and identified if they occurred more than once across different mixtures, even when the same sounds were impossible to segregate in single mixtures. Sensitivity to the repetition of sound sources can permit their recovery in the absence of other segregation cues or prior knowledge of sounds, and could help solve the cocktail party problem.


Conflict of interest statement

The authors declare no conflict of interest.

Figures

Fig. 1.
Fig. 1.
Stimulus generation and results of Experiment 1. (A and B) Time-frequency decomposition of a spoken word and a bullfrog vocalization. (C and D) Correlation between nearby time-frequency cells as a function of their temporal (C) and spectral (D) separation. (E and F) Two spectrograms generated by our model. (G) Spectrogram of the mixture of the sounds from E and F. (H) Spectrogram of an incorrect probe sound, generated to be physically consistent with the mixture in G. (I) Results and stimulus configurations from Experiment 1. Line segments represent sounds; sounds presented simultaneously are drawn as vertically displaced. Distinct sounds are indicated by different colors. Red segments represent target sounds, and black segments represent probe sounds. Error bars denote SEs. The dashed line represents the chance performance level.
Fig. 2.
Fig. 2.
Effect of multiple mixtures on sound source recovery. (A) Different numbers of mixtures were presented. (B) Ten mixtures were presented in all conditions, and the number of different mixtures was varied. Conventions here and elsewhere are as in Fig. 1I. Red segments represent target probes, black segments represent incorrect probes, and different colors represent different sounds. Schematics for conditions with 5 and 10 mixtures are omitted.
Fig. 3.
Fig. 3.
Stimuli and results of Experiment 3. (A) Effect of mixture variability persists with asynchronous and alternating presentation. Conditions 3 and 4 differ in the pairing of the target with variable (condition 3) or repeated (condition 4) distractors. (B) Subjects can perform task even when incorrect probes are time-reversed versions of the target sound, or when the target sound is presented irregularly.
Fig. 4.
Fig. 4.
Effect of interstimulus interval. In all conditions, the target sounds (shown in red) were presented six times. Condition 0 is identical to the variable mixture conditions of Experiment 2 except for the number of target presentations.
Fig. 5.
Fig. 5.
A candidate computational scheme to extract a repeating target sound from mixtures. (A) Spectrogram of a sequence of mixtures of one target sound with various distractors. (B) Spectrograms of target sound estimates after each iteration of the algorithm. Only the first 300 ms is shown for ease of comparison with D. (C) Cross-correlation of target estimate with the next block of the input spectrogram from A, as a function of the time shift applied to the spectrogram block. The red circle denotes the peak of the correlation function as found by a peak-picking algorithm. (D) Spectrogram of the true target sound. Note the resemblance to the target estimate after five iterations, shown directly above.

References

    1. Bregman AS. Auditory Scene Analysis: The Perceptual Organization of Sound. Cambridge, MA: MIT Press; 1990.
    1. Darwin CJ, Carlyon RP. Auditory grouping. In: Moore BCJ, editor. The Handbook of Perception and Cognition. Vol. 6. New York: Academic; 1995.
    1. Bronkhorst AW. The cocktail party phenomenon: A review of research on speech intelligibility in multiple-talker conditions. Acustica. 2000;86:117–128.
    1. Narayan R, et al. Cortical interference effects in the cocktail party problem. Nat Neurosci. 2007;10:1601–1607. - PubMed
    1. Bee MA, Micheyl C. The cocktail party problem: What is it? How can it be solved? And why should animal behaviorists study it? J Comp Psychol. 2008;122:235–251. - PMC - PubMed

LinkOut - more resources