. 2011 Jan 10;192(1):111-9.
doi: 10.1083/jcb.201009037. Epub 2011 Jan 3.

Correlated fluorescence and 3D electron microscopy with high sensitivity and spatial precision

Affiliations

Correlated fluorescence and 3D electron microscopy with high sensitivity and spatial precision

Wanda Kukulski et al. J Cell Biol. .

Abstract

Correlative electron and fluorescence microscopy has the potential to elucidate the ultrastructural details of dynamic and rare cellular events, but has been limited by low precision and sensitivity. Here we present a method for direct mapping of signals originating from ∼20 fluorescent protein molecules to 3D electron tomograms with a precision of less than 100 nm. We demonstrate that this method can be used to identify individual HIV particles bound to mammalian cell surfaces. We also apply the method to image microtubule end structures bound to mal3p in fission yeast, and demonstrate that growing microtubule plus-ends are flared in vivo. We localize Rvs167 to endocytic sites in budding yeast, and show that scission takes place halfway through a 10-s time period during which amphiphysins are bound to the vesicle neck. This new technique opens the door for direct correlation of fluorescence and electron microscopy to visualize cellular processes at the ultrastructural scale.


Figures
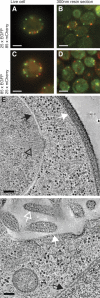
Figure 1.
Figure 1.
Preservation of fluorescence and ultrastructure. Preservation of fluorescent protein signals tagged to endocytic proteins in S. cerevisiae. (A and B) Sla1-EGFP/Abp1-mCherry, (C and D) Sla1-mCherry/Abp1-EGFP. Left panels (A and C) are live-cell fluorescence microscopy images, right panels (B and D) are fluorescent microscopy images of 300-nm resin sections on EM grids. (E and F) Slices through electron tomograms show preservation of fine structure in S. cerevisiae (E) and MDCK cells (F). Both were subjected to cryo-immobilization by HPF, FS with 0.1% uranyl acetate in acetone, and low-temperature embedding in Lowicryl resin. Example features are marked: the plasma membrane (white arrows), nuclear envelope (black arrows), cytoskeletal elements such as spindle pole body and nuclear microtubuli (black open arrow), and filopodia (white open arrow). Bars: (A–D) 2 µm; (E and F) 100 nm.
Figure 2.
Figure 2.
Correlation procedure based on fiducials. (A) Merge of GFP and RFP channels of Rvs167-EGFP/Abp1-mCherry expressed in S. cerevisiae. The patch of interest is highlighted by the circle. Inset shows the Rvs167-EGFP signal of that patch, boxed as for centroid fitting. A cross marks the resulting centroid position. (B) Blue FluoSpheres (365 nm/415 nm) channel. Fiducials selected for correlation are marked with yellow circles and numbers. (C) Same fiducials as in B present on merged slices of the section surface from a tomogram of the cell of interest are assigned to the corresponding fluorescent spots in the FM image (marked by yellow circles and numbers). White circle and guidelines correspond to A and B after applying the optimal transform, calculated using the coordinates of the selected fiducials. (D) Slice of high magnification tomogram showing the endocytic invagination. Cross marks the centroid coordinates of the fluorescent patch transformed into tomogram coordinates. The inner circle corresponds to a probability radius of 50% (33 nm), outer circle to 80% (89 nm). Bars: (A–C) 1 µm; (D) 50 nm.
Figure 3.
Figure 3.
Localization error plotted against the percentage of correlations. Percentage of correlated fiducials (x-axis) found within a certain distance (y-axis) of the position predicted using the optimal transformation calculated excluding that fiducial. The three curves correspond to three different datasets: MDCK cells (yellow), S. cerevisiae (blue), and S. pombe (green). Accuracies for 50% and 80% of predictions are marked with dashed and dotted lines, respectively.
Figure 4.
Figure 4.
Application of correlative method to three different systems. Top panels (A–C) show fluorescence microscopy images of resin sections, merge of GFP and RFP channels. Bottom panels (D–F) are electron tomography slices of boxed areas (see also Videos 1–3). (A) HIV particles labeled with MA-EGFP on MDCK cells expressing H2B-RFP. (D) MA-EGFP–labeled HIV particles can be identified in close proximity to filopodia. (B) RFP-mal3p, GFP-atb2p expressed in S. pombe. (E) RFP-mal3p located at a microtubule end. (C) Rvs167-EGFP, Abp1-mCherry expressed in S. cerevisiae. (F) Spot of Rvs167-EGFP colocalizing with Abp1-mCherry marks an endocytic invagination of the plasma membrane. Inner and outer circles correspond to 50% and 80% prediction accuracy, whereas green and red circles stand for GFP and RFP signals, respectively. Bars: (A–C) 5 µm; (D–F) 100 nm.
Figure 5.
Figure 5.
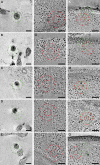
Example gallery from the three different systems. Representative ultrastructures found when targeting HIV particles labeled with MA-EGFP on MDCK cells (A–E), mal3p-RFP spots expressed in S. pombe (F–J), and Rvs167-EGFP colocalizing with Abp1-mCherry in S. cerevisiae (K–O). Inner and outer circles correspond to 50% and 80% prediction accuracy, whereas green and red circles stand for GFP and RFP signals, respectively. Bars, 100 nm.

References

    1. Akhmanova A., Hoogenraad C.C. 2005. Microtubule plus-end-tracking proteins: mechanisms and functions. Curr. Opin. Cell Biol. 17:47–54 10.1016/j.ceb.2004.11.001 - DOI - PubMed
    1. Akhmanova A., Steinmetz M.O. 2008. Tracking the ends: a dynamic protein network controls the fate of microtubule tips. Nat. Rev. Mol. Cell Biol. 9:309–322 10.1038/nrm2369 - DOI - PubMed
    1. Busch K.E., Brunner D. 2004. The microtubule plus end-tracking proteins mal3p and tip1p cooperate for cell-end targeting of interphase microtubules. Curr. Biol. 14:548–559 10.1016/j.cub.2004.03.029 - DOI - PubMed
    1. Chlanda P., Carbajal M.A., Cyrklaff M., Griffiths G., Krijnse-Locker J. 2009. Membrane rupture generates single open membrane sheets during vaccinia virus assembly. Cell Host Microbe. 6:81–90 10.1016/j.chom.2009.05.021 - DOI - PubMed
    1. Chrétien D., Fuller S.D., Karsenti E. 1995. Structure of growing microtubule ends: two-dimensional sheets close into tubes at variable rates. J. Cell Biol. 129:1311–1328 10.1083/jcb.129.5.1311 - DOI - PMC - PubMed