

Geographic inequity in access to livers for transplantation
- PMID: 21200366
- PMCID: PMC3772346
- DOI: 10.1097/TP.0b013e3182066275
Geographic inequity in access to livers for transplantation
Abstract
Background: Liver transplantation offers life-saving therapy for patients with decompensated liver disease or T2 hepatocellular carcinomas. In the United States, deceased donor livers are primarily allocated by Model for End-Stage Liver Disease (MELD) score within each of the country's more than 50 donation service areas (DSAs). Variation in DSA size, population, and organ availability have engendered concern that unequal access to deceased donor livers across DSAs contributes to geographic variability in outcome.
Methods: To determine the extent to which DSA variability in organ availability correlated with combined waitlist and posttransplant mortality, we analyzed retrospectively national waitlist and posttransplant data for a 7-year period after implementation of the current MELD-based allocation system.
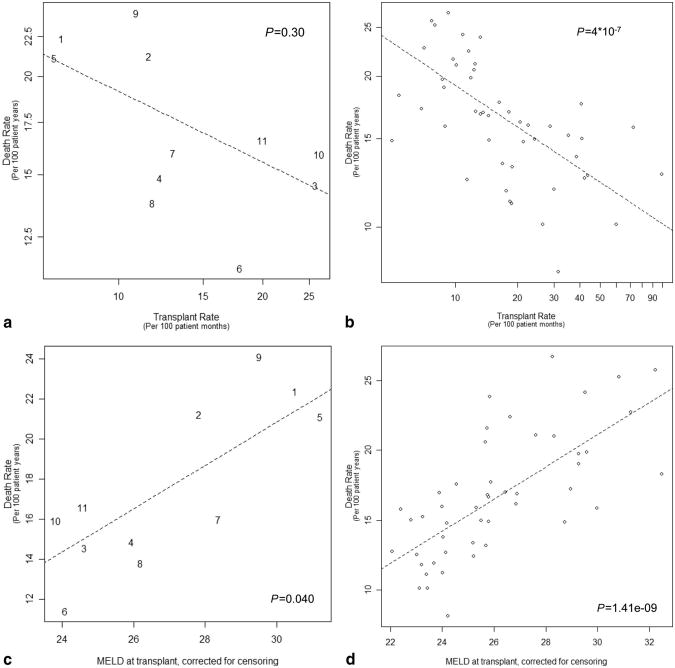
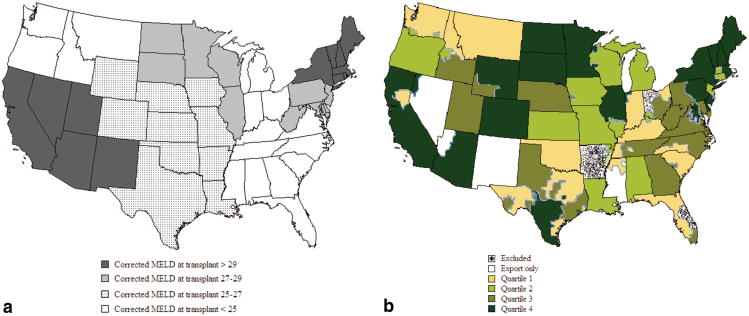
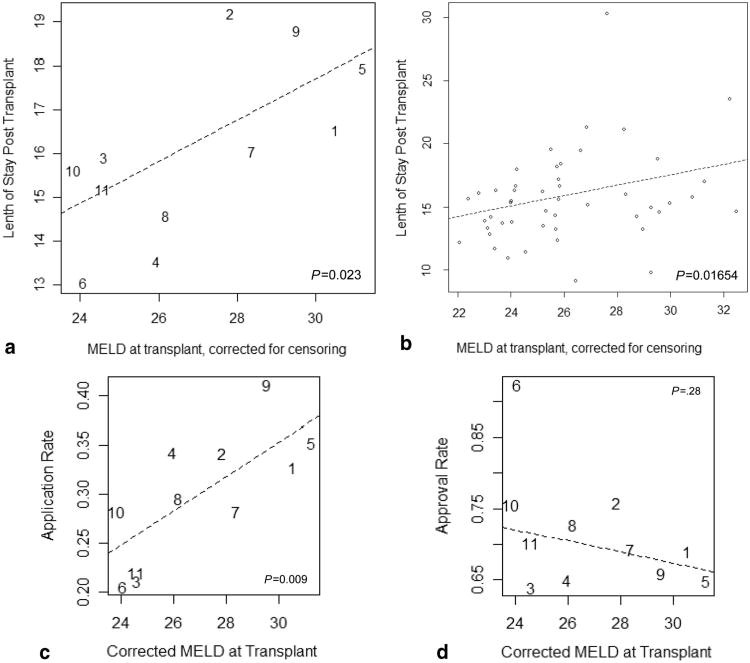
Results: Marked variation among DSAs was evident in death rate (3.3-fold), transplant rate (20-fold), and mean transplant MELD (>10 points). Death rate correlated with organ availability was assessed by transplant rate and transplant MELD. DSAs with low organ availability included the country's largest cities, had more new listings per capita, larger waitlists, more transplant centers per DSA, and a higher proportion of black and Asian patients. DSAs of organ shortage were also characterized by more frequent dual listing at another transplant center, more living donor liver transplants, and increased average length of the transplant admission.
Conclusions: Geographic differences in deceased donor organ availability contribute to variation in overall death rate of liver transplant patients, shape the clinical practice of transplant, and influence the resources consumed per transplant. Geographic variation in organ access results primarily from rates of listing rather than donation. Our findings highlight the need to restructure organ distribution areas to achieve equal access to deceased donor livers for transplantation in the United States.
Figures
References
-
- Malinchoc M, Kamath PS, Gordon FD, et al. A model to predict poor survival in patients undergoing transjugular intrahepatic portosystemic shunts. Hepatology. 2000;31:864. - PubMed
-
- Kamath PS, Wiesner RH, Malinchoc M, et al. A model to predict survival in patients with end stage liver disease. Hepatology. 2001;33:464. - PubMed
-
- Freeman RB, Wiesner RH, Edwards E, et al. Results of the first year of the new liver allocation plan. Liver Transpl. 2004;10:7. - PubMed
-
- Trotter JF, Osgood MJ. MELD scores of liver transplant recipients according to size of waiting list: Impact of organ allocation and patient outcomes. JAMA. 2004;291:1871. - PubMed
-
- Saab S, Wang V, Ibrahim AB, et al. MELD score predicts 1-year patient survival post-orthotopic liver transplantation. Liver Transpl. 2003;9:473. - PubMed
MeSH terms
Grants and funding
LinkOut - more resources
Full Text Sources
Medical
