

Quantitative in vivo magnetic resonance spectroscopy using synthetic signal injection
- PMID: 21203385
- PMCID: PMC3010995
- DOI: 10.1371/journal.pone.0015166
Quantitative in vivo magnetic resonance spectroscopy using synthetic signal injection
Abstract
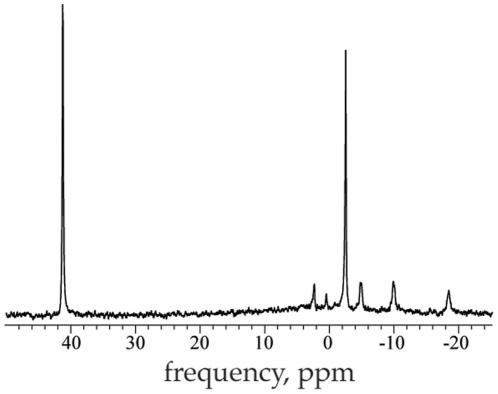
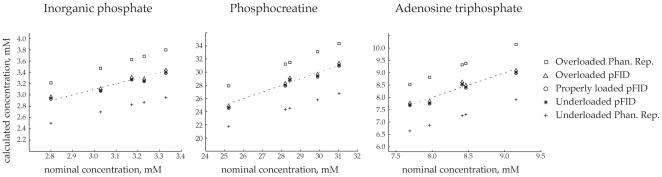
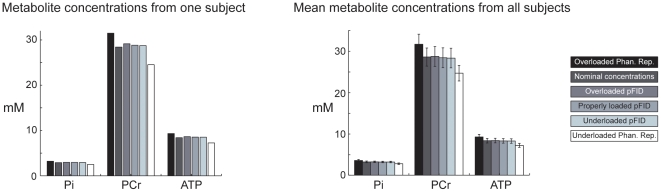
Accurate conversion of magnetic resonance spectra to quantitative units of concentration generally requires compensation for differences in coil loading conditions, the gains of the various receiver amplifiers, and rescaling that occurs during post-processing manipulations. This can be efficiently achieved by injecting a precalibrated, artificial reference signal, or pseudo-signal into the data. We have previously demonstrated, using in vitro measurements, that robust pseudo-signal injection can be accomplished using a second coil, called the injector coil, properly designed and oriented so that it couples inductively with the receive coil used to acquire the data. In this work, we acquired nonlocalized phosphorous magnetic resonance spectroscopy measurements from resting human tibialis anterior muscles and used pseudo-signal injection to calculate the Pi, PCr, and ATP concentrations. We compared these results to parallel estimates of concentrations obtained using the more established phantom replacement method. Our results demonstrate that pseudo-signal injection using inductive coupling provides a robust calibration factor that is immune to coil loading conditions and suitable for use in human measurements. Having benefits in terms of ease of use and quantitative accuracy, this method is feasible for clinical use. The protocol we describe could be readily translated for use in patients with mitochondrial disease, where sensitive assessment of metabolite content could improve diagnosis and treatment.
Conflict of interest statement
Figures

References
-
- Kreis R, Ernst T, Ross BD. Development of the human brain: in vivo quantification of metabolite and water content with proton magnetic resonance spectroscopy. Magn Reson Med. 1993;30:424–437. - PubMed
-
- Kreis R, Slotboom J, Hofmann L, Boesch C. Integrated data acquisition and processing to determine metabolite contents, relaxation times, and macromolecule baseline in single examinations of individual subjects. Magn Reson Med. 2005;54:761–768. - PubMed
-
- Barantin L, LePape A, Akoka S. A new method for absolute quantitation of MRS metabolites. Mag Reson in Med. 1997;38:179–182. - PubMed
-
- Akoka S, Trierweiler M. Improvement of the ERETIC method by digital synthesis of the signal and addition of a broadband antenna inside the NMR probe. Instr Sci and Tech. 2002;30:21–29.
-
- Akoka S, Barantin L, Trierweiler M. Concentration measurement by proton NMR using the ERETIC method. Anal Chem. 1999;71:2554–2557. - PubMed
Publication types
MeSH terms
Substances
Grants and funding
LinkOut - more resources
Full Text Sources
Research Materials
Miscellaneous
