. 2010 Dec 28;5(12):e14435.
doi: 10.1371/journal.pone.0014435.

RAF kinase activity regulates neuroepithelial cell proliferation and neuronal progenitor cell differentiation during early inner ear development

Affiliations

RAF kinase activity regulates neuroepithelial cell proliferation and neuronal progenitor cell differentiation during early inner ear development

Marta Magariños et al. PLoS One. .

Abstract

Background: Early inner ear development requires the strict regulation of cell proliferation, survival, migration and differentiation, coordinated by the concerted action of extrinsic and intrinsic factors. Deregulation of these processes is associated with embryonic malformations and deafness. We have shown that insulin-like growth factor I (IGF-I) plays a key role in embryonic and postnatal otic development by triggering the activation of intracellular lipid and protein kinases. RAF kinases are serine/threonine kinases that regulate the highly conserved RAS-RAF-MEK-ERK signaling cascade involved in transducing the signals from extracellular growth factors to the nucleus. However, the regulation of RAF kinase activity by growth factors during development is complex and still not fully understood.

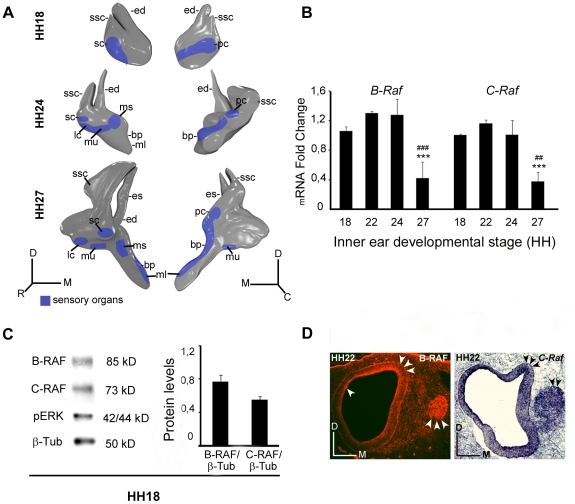
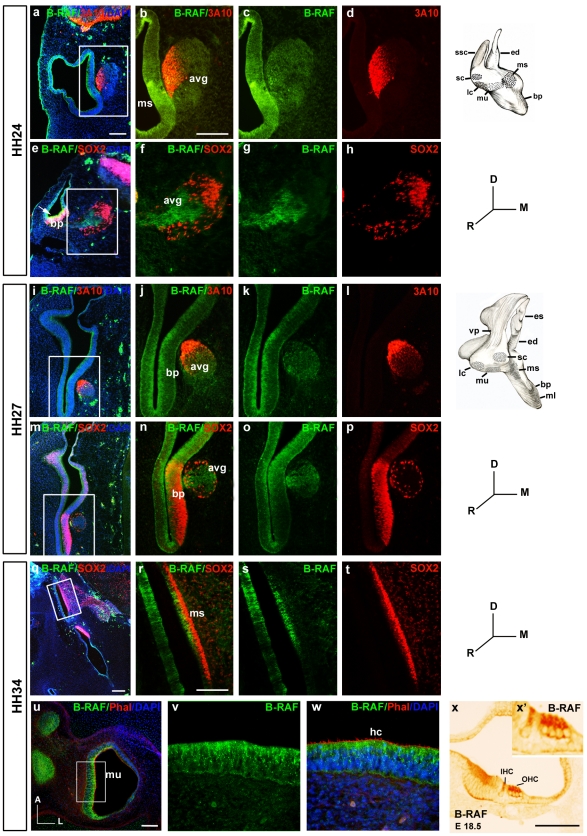
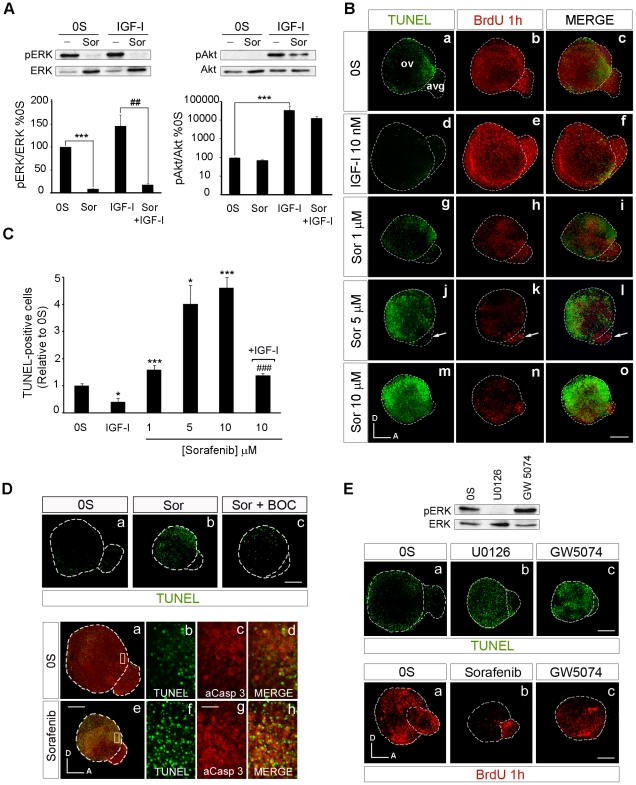
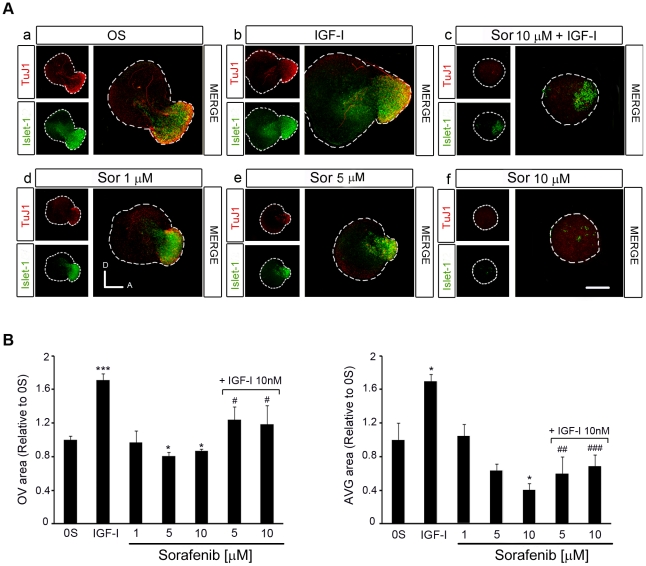
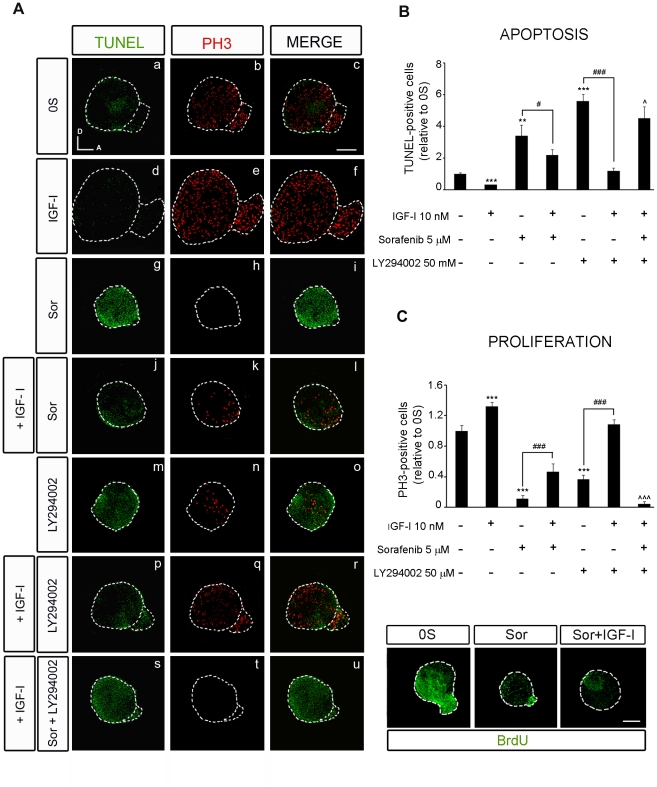
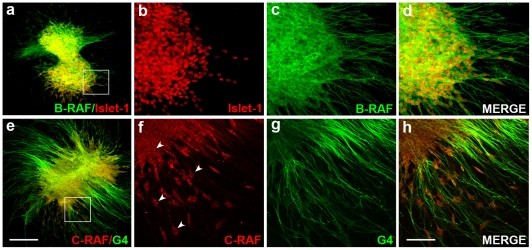
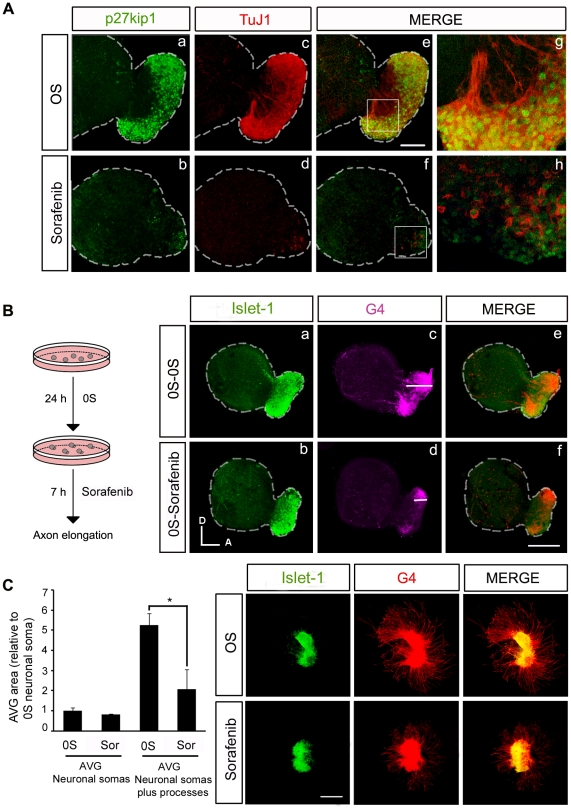
Methodology/principal findings: By using a combination of qRT-PCR, Western blotting, immunohistochemistry and in situ hybridization, we show that C-RAF and B-RAF are expressed during the early development of the chicken inner ear in specific spatiotemporal patterns. Moreover, later in development B-RAF expression is associated to hair cells in the sensory patches. Experiments in ex vivo cultures of otic vesicle explants demonstrate that the influence of IGF-I on proliferation but not survival depends on RAF kinase activating the MEK-ERK phosphorylation cascade. With the specific RAF inhibitor Sorafenib, we show that blocking RAF activity in organotypic cultures increases apoptosis and diminishes the rate of cell proliferation in the otic epithelia, as well as severely impairing neurogenesis of the acoustic-vestibular ganglion (AVG) and neuron maturation.

Conclusions/significance: We conclude that RAF kinase activity is essential to establish the balance between cell proliferation and death in neuroepithelial otic precursors, and for otic neuron differentiation and axonal growth at the AVG.


Conflict of interest statement

Competing Interests: The authors have declared that no competing interests exist.

Figures

Figure 1
Figure 1. Expression of the B-RAF and C-RAF kinases during otic development.
(A) Schematic drawings showing the development of the chicken inner ear at Hamburger and Hamilton stages HH18, HH24 and HH27. (B) Expression of inner ear B-Raf and C-Raf mRNA analyzed by qRT-PCR at different stages using Eukaryotic 18S rRNA as the endogenous housekeeping control gene. Gene expression was calculated as 2−ΔΔCt and normalized to the levels at HH18. The results are expressed as the mean ± SEM of at least three independent experiments performed in triplicate. Statistical significance was estimated with the Student's t-test: ***P<0.005 versus HH18, ##P<0.01 versus HH24 and ###P<0.005 versus HH24. (C) HH18 otic vesicle lysates analyzed in western blots to determine the levels of B-RAF, C-RAF and phosphorylated ERK (pERK). ß-Tubulin (ß-Tub) was used as a loading control. A representative blot of three independent experiments is shown and the average densitometric measurements of the B-RAF and C-RAF bands are plotted as bars. The results are given as the mean ± SEM of three independent experiments. (D) Immunofluorescence of B-RAF and in situ hybridization of C-Raf at HH22 and HH24, respectively showing their location in the otic epithelium and acoustic-vestibular ganglion (arrowheads). Abbreviations: bp, basilar papilla; ed, endolymphatic duct; es, endolymphatic sac; lc, lateral crista; ml, macula lagena; ms, macula sacculi; mu, macula utriculi; pc, posterior crista; sc, superior crista; ssc, superior semicircular canal. Orientation: C, caudal; D, dorsal; M, medial; R, rostral.
Figure 2
Figure 2. Spatiotemporal expression of B-RAF in the developing inner ear.
ah) At stage HH24, B-RAF (green throughout the figure) is abundantly expressed in the macula sacculi (ms) and in the acoustic-vestibular ganglion (avg), which is labelled red due to the expression of the axonal marker 3A10 (ad). B-RAF is expressed strongly in the basilar papilla (bp, e, arrow). B-RAF and SOX2 (red), a transcription factor essential for the self-renewal of undifferentiated otic progenitors, are expressed in non-overlapping regions of the avg (eh). ip) At HH27, B-RAF is expressed strongly in the internal cell layers of the basilar papilla (bp, il), whereas SOX2 is present in more external cell layers (mp). qw) At HH34, SOX2 is expressed in supporting cells of the ms whereas B-RAF labels the hair cells (hc: qt). TxRed-phalloidin staining (red) labels actin in the hc stereocilia of the macula utriculi (mu), and B-RAF is evident in the cytoplasm (uw). B-RAF is also expressed in the outer (OHC) and inner hair cells (IHC) of E18.5 mouse embryos (x). x′ shows a higher magnification of the sensory region in x. Schematic drawings of HH24 and HH27 inner ears are shown. The boxed areas show higher magnifications of the selected regions. Abbreviations: avg, acoustic-vestibular ganglion; bp, basilar papilla; ed, endolymphatic duct; es, endolymphatic sac; hc, hair cells; IHC, inner hair cells; OHC, outer hair cells; lc, lateral crista; ml, macula lagena; ms, macula sacculi; mu, macula utriculi; sc, superior crista; ssc, superior semicircular canal; vp, vertical canal pouch. Orientation: D, dorsal; M, medial; R, rostral. Scale bars: 100 µm.
Figure 3
Figure 3. Selective inhibition of the RAF-MEK-ERK cascade blocks proliferation and promotes apoptosis.
(A) Sorafenib inhibits the RAF-MEK-ERK pathway. Otic vesicles were explanted from stage HH18 chicken embryos and incubated for 24 h in serum-free medium (0S). The explants were then incubated for 1 h in serum-free medium without additives (0S), with IGF-I (10 nM), Sorafenib (Sor; 5 µM) or a combination of both IGF-I and Sorafenib. Otic vesicles were lysed and the levels of phosphorylated and unphosphorylated ERK and Akt kinases were quantified in Western blots by densitometry, as described in Materials and Methods. Representative blots are shown in the upper row. The results are expressed relative to the control value (0S), which was given an arbitrary value of 100, as the mean ± SEM of three independent experiments. Statistical significance was estimated with the Student's t-test: ***P<0.005 versus 0S and ##P<0.01 versus IGF-I. (B) Apoptosis and proliferation in Sorafenib-treated cultures of otic vesicles. Apoptotic cell death was visualized by TUNEL (green) in cultured otic vesicles. Proliferation was measured by the incorporation of BrdU (red) over 1 h. Otic vesicles were isolated from HH18 chicken embryos, made quiescent and cultured for 24 h in serum-free culture medium without additives (0S), with IGF-I (10 nM), Sorafenib (Sor; 1, 5 or 10 µM) or a combination of both IGF-I and Sorafenib. Scale bars, 150 µm. (C) Cell death quantification of B. The TUNEL positive nuclei were quantified relative to the 0S condition, which was given an arbitrary value of 1. The bars show the mean ± SEM of at least five otic vesicles from any of the conditions shown in B. Statistical significance was estimated with the Student's t-test: *P<0.05 versus control, ***P<0.005 versus control, ###P<0.005 versus Sorafenib 10 µM. (D) Sorafenib increases cell death through a caspase-dependent mechanism. Otic vesicles were isolated from HH18 chicken embryos and cultured for 24 h in serum-free culture medium without stimuli (0S; a upper panel), or cultured in the presence of Sorafenib 5 µM (Sor; b upper panel) or in combination with the pan-caspase inhibitor Boc-D-FMK 50 µM (Sor+BOC; c upper panel) and cell death was visualized using the TUNEL technique. Lower panel shows apoptotic cell death visualized by TUNEL staining (green) and immunostaining for activated-caspase-3 (red) of otic vesicles cultured in free serum (0S, a–d) or in the presence of Sorafenib 5 µM (e–h). Boxed areas in a and e are shown at a higher magnification to show the TUNEL-positive nuclei (b,f and merge) surrounded by activated caspase-3 (c,g and merge). Scale bar, 150 µm (a,e); 20 µm (b–d and f–h). (E) Treatment of cultured otic vesicles with the MEK inhibitor U0126 and with the C-RAF inhibitor GW5074. A representative blot of the effects of U0126 (50 µM) and GW5074 (1 µM) on ERK phosphorylation is shown. Apoptosis in cultured otic vesicles was visualized with TUNEL (upper panels, a–c). Proliferation was measured by the incorporation of BrdU (red) over 1 h in otocysts cultured with no additives (0S), with Sorafenib (5 µM) or with GW5074 (1 µM) (lower panels, a–c). Scale bar: 150 µm. Compiled projections of confocal microscopy images from otic vesicles are shown. A, anterior; D, dorsal. Abbreviations: AVG, acoustic-vestibular ganglion; OV, otic vesicle. The images shown are representative of at least three independent experiments, using five to six otic vesicles per condition.
Figure 4
Figure 4. Inhibition of the RAF-MEK-ERK cascade impairs AVG formation.
(A) Otic vesicles were isolated from HH18 chicken embryos and incubated for 24 h in serum-free culture medium without additives (0S), with IGF-I (10 nM), Sorafenib, (Sor;1, 5 or 10 µM) or a combination of Sor (10 µM) and IGF-I. Whole otic vesicles were then immunostained for the ganglion neuroblast nuclei marker Islet-1 (green) and for the marker of neural processes, TuJ1 (red). Fluorescence images were obtained from the compiled projections of confocal images of otic vesicles. Representative images of at least five to six otic vesicles per condition and from at least three independent experiments are shown. Orientation: A, anterior; D, dorsal. Scale bar: 150 µm. (B) The otic vesicles (OV) and the acoustic-vestibular ganglia (AVG) areas were measured with Image Analysis Software (Olympus, Tokyo, Japan). The data are expressed as the mean ± SEM relative to the control value (0S) and they were compiled from the analysis of at least five to six otic vesicles per condition. Statistical significance was estimated with the Student's t-test: *P<0.05, ***P<0.005 versus 0S; #P<0.05, ##P<0.01 and ###P<0.005 versus IGF-I.
Figure 5
Figure 5. IGF-I partially rescues the effects of inhibiting RAF activity through the PI3K/Akt kinase pathway.
(A) Apoptotic cell death was visualized by TUNEL (green) in cultured otic vesicles and proliferation was detected with the mitosis marker Phospho-Histone 3 (PH3, red). Otic vesicles were isolated from HH18 chicken embryos and cultured for 24 h in serum-free medium without additives (0S, a–c), with IGF-I (10 nM, d–f), Sorafenib, Sor, (5 µM, g–i), LY294002 (50 µM, m–o), a combination of IGF-I and Sor (j–l), IGF-I and LY294002 (p–r) or IGF-I, Sor and LY294002 (s–u). (B) TUNEL positive or (C) proliferative PH3-labeled cells were quantified as described in at least 5 otic vesicles per condition. The results are shown as the mean ± SEM relative to the 0S condition. Statistical significance was estimated with the Student's t-test: *P<0.05, ***P<0.005 versus 0S; #P<0.05 and ###P<0.005 versus the indicated inhibitors; P<0.05, ∧∧∧P<0.005 versus Sorafenib +IGF-I. Lower panels in C show BrdU (green) incorporation into cultured otic vesicles incubated for 24 h in the following conditions: 0S, with Sor (5 µM), or a combination of Sor and IGF-I (10 nM). Compiled projections of confocal images from otic vesicles are shown, and are representative of at least five to six otic vesicles per condition from three different experiments. Scale bar, 150 µm.
Figure 6
Figure 6. RAF proteins show different subcellular distribution in the acoustic- vestibular ganglion.
AVG explants were obtained from stage HH19 chicken embryos and cultured in serum-free medium for 20 h with no additives (0S). (ad) Whole AVG explants were immunostained for B-RAF (green) and Islet-1 (red) or (eh) for C-RAF (red) and G4 (green), The cytoplasmatic distribution of C-RAF is shown (arrowheads). Fluorescence images were obtained from compiled projections of confocal images of AVG. Scale bar, 350 µm (a, e); 75 µm (b–d, f–h).
Figure 7
Figure 7. RAF kinase activity is required for the correct outgrowth of sensory otic neuron processes.
(A) Otic vesicles were isolated from HH18 chicken embryos and incubated for 24 h either in serum-free medium without additives (0S, a,c,e,g) or in the presence of Sorafenib (2.5 µM) (b,d,f,h). Immunohistochemistry of whole otic vesicles was carried out by double-staining for the nuclear cyclin-dependent kinase inhibitor p27kip1 (green) and for the marker of neural processes, TuJ1 (red). The boxed areas in panels e and f, correspond to the enlarged images in panels g and h respectively. Scale bar: 75 µm. (B) Otic vesicles were isolated from HH18 chicken embryos and incubated for 24 h in serum-free medium as in the 0S condition in A, and they were then incubated for a further 7 h without additives (0S-0S, a,c,e) or with Sorafenib (2.5 µM: 0S-Sorafenib, b,d,f). Whole otic vesicles were immunostained for the ganglion neuroblast nuclei marker, Islet-1 (green), and for the G4-glycoprotein marker of neuronal processes (G4, magenta). Note the differences in the magnitude of the white bars in the region in the acoustic-vestibular ganglia corresponding to the staining of neural processes in panels c and d. Scale bar: 150 µm. (C) Acoustic-vestibular ganglia (AVG) explants were obtained from stage HH19 chicken embryos and cultured in serum-free medium for 20 h with no additives (0S) or with Sorafenib (2.5 µM). Whole AVG explants were immunostained for G4 (red) and Islet-1 (green). Sorafenib-treated AVG have shorter processes. Scale bar: 300 µm. Fluorescence images were obtained from compiled projections of confocal images of otic vesicles and AVG. Bar graph on the left shows the quantification of the neuronal soma area in the AVG, which does not vary following Sorafenib treatment. In contrast, there is a statistically significant difference in the area of the AVG covered by processes (*P<0.05, Sorafenib versus 0S). Representative images of three independent experiments using five to six otic vesicles or AVG per condition are shown. Orientation: A, anterior; D, dorsal.

Similar articles

Cited by

References

    1. Kelley MW. Regulation of cell fate in the sensory epithelia of the inner ear. Nat Rev Neurosci. 2006;7:837–849. - PubMed
    1. Rubel EW, Fritzsch B. Auditory system development: primary auditory neurons and their targets. Annu Rev Neurosci. 2002;25:51–101. - PubMed
    1. León Y, Sánchez-Galiano S, Gorospe I. Programmed cell death in the development of the vertebrate inner ear. Apoptosis. 2004;9:255–264. - PubMed
    1. Sanchez-Calderon H, Milo M, Leon Y, Varela-Nieto I. A network of growth and transcription factors controls neuronal differentation and survival in the developing ear. Int J Dev Biol. 2007;51:557–570. - PubMed
    1. Davies D. Temporal and spatial regulation of alpha6 integrin expression during the development of the cochlear-vestibular ganglion. J Comp Neurol. 2007;502:673–682. - PubMed

Publication types

MeSH terms