The PTEN phosphatase controls intestinal epithelial cell polarity and barrier function: role in colorectal cancer progression
- PMID: 21203412
- PMCID: PMC3009737
- DOI: 10.1371/journal.pone.0015742
The PTEN phosphatase controls intestinal epithelial cell polarity and barrier function: role in colorectal cancer progression
Abstract
Background: The PTEN phosphatase acts on phosphatidylinositol 3,4,5-triphosphates resulting from phosphatidylinositol 3-kinase (PI3K) activation. PTEN expression has been shown to be decreased in colorectal cancer. Little is known however as to the specific cellular role of PTEN in human intestinal epithelial cells. The aim of this study was to investigate the role of PTEN in human colorectal cancer cells.
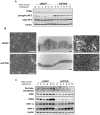
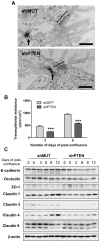
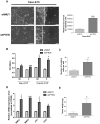
Methodology/principal findings: Caco-2/15, HCT116 and CT26 cells were infected with recombinant lentiviruses expressing a shRNA specifically designed to knock-down PTEN. The impact of PTEN downregulation was analyzed on cell polarization and differentiation, intercellular junction integrity (expression of cell-cell adhesion proteins, barrier function), migration (wound assay), invasion (matrigel-coated transwells) and on tumor and metastasis formation in mice. Electron microscopy analysis showed that lentiviral infection of PTEN shRNA significantly inhibited Caco-2/15 cell polarization, functional differentiation and brush border development. A strong reduction in claudin 1, 3, 4 and 8 was also observed as well as a decrease in transepithelial resistance. Loss of PTEN expression increased the spreading, migration and invasion capacities of colorectal cancer cells in vitro. PTEN downregulation also increased tumor size following subcutaneous injection of colorectal cancer cells in nude mice. Finally, loss of PTEN expression in HCT116 and CT26, but not in Caco-2/15, led to an increase in their metastatic potential following tail-vein injections in mice.
Conclusions/significance: Altogether, these results indicate that PTEN controls cellular polarity, establishment of cell-cell junctions, paracellular permeability, migration and tumorigenic/metastatic potential of human colorectal cancer cells.
Conflict of interest statement
Figures


Similar articles
-
Escherichia coli Alpha-Hemolysin HlyA Induces Host Cell Polarity Changes, Epithelial Barrier Dysfunction and Cell Detachment in Human Colon Carcinoma Caco-2 Cell Model via PTEN-Dependent Dysregulation of Cell Junctions.Toxins (Basel). 2021 Jul 26;13(8):520. doi: 10.3390/toxins13080520. Toxins (Basel). 2021. PMID: 34437391 Free PMC article.
-
MicroRNA-21 (Mir-21) Promotes Cell Growth and Invasion by Repressing Tumor Suppressor PTEN in Colorectal Cancer.Cell Physiol Biochem. 2017;43(3):945-958. doi: 10.1159/000481648. Epub 2017 Sep 29. Cell Physiol Biochem. 2017. PMID: 28957811
-
PTEN deletion potentiates invasion of colorectal cancer spheroidal cells through 3D Matrigel.Integr Biol (Camb). 2015 Mar;7(3):324-34. doi: 10.1039/c4ib00298a. Epub 2015 Jan 27. Integr Biol (Camb). 2015. PMID: 25625883
-
MicroRNA-21 promotes phosphatase gene and protein kinase B/phosphatidylinositol 3-kinase expression in colorectal cancer.World J Gastroenterol. 2016 Jun 28;22(24):5532-9. doi: 10.3748/wjg.v22.i24.5532. World J Gastroenterol. 2016. PMID: 27350731 Free PMC article.
-
Odontogenic ameloblast-associated protein (ODAM) inhibits human colorectal cancer growth by promoting PTEN elevation and inactivating PI3K/AKT signaling.Biomed Pharmacother. 2016 Dec;84:601-607. doi: 10.1016/j.biopha.2016.09.076. Epub 2016 Sep 29. Biomed Pharmacother. 2016. PMID: 27694004
Cited by
-
Inactivation of MYO5B promotes invasion and motility in gastric cancer cells.Dig Dis Sci. 2012 May;57(5):1247-52. doi: 10.1007/s10620-011-1989-z. Epub 2011 Dec 2. Dig Dis Sci. 2012. PMID: 22134786
-
Escherichia coli Alpha-Hemolysin HlyA Induces Host Cell Polarity Changes, Epithelial Barrier Dysfunction and Cell Detachment in Human Colon Carcinoma Caco-2 Cell Model via PTEN-Dependent Dysregulation of Cell Junctions.Toxins (Basel). 2021 Jul 26;13(8):520. doi: 10.3390/toxins13080520. Toxins (Basel). 2021. PMID: 34437391 Free PMC article.
-
MicroRNA-7-5p regulates the proliferation and migration of intestinal epithelial cells by targeting trefoil factor 3 via inhibiting the phosphoinositide 3-kinase/Akt signalling pathway.Int J Mol Med. 2017 Nov;40(5):1435-1443. doi: 10.3892/ijmm.2017.3120. Epub 2017 Sep 6. Int J Mol Med. 2017. PMID: 28901375 Free PMC article.
-
PEGylated silicon nanowire coated silica microparticles for drug delivery across intestinal epithelium.Biomaterials. 2012 Feb;33(5):1663-72. doi: 10.1016/j.biomaterials.2011.11.010. Epub 2011 Nov 23. Biomaterials. 2012. PMID: 22116000 Free PMC article.
-
The PTEN-Akt pathway impacts the integrity and composition of mitotic centrosomes.Cell Cycle. 2013 May 1;12(9):1406-15. doi: 10.4161/cc.24516. Epub 2013 Apr 9. Cell Cycle. 2013. PMID: 23574721 Free PMC article.
References
-
- Hermanek P. pTNM and residual tumor classifications: problems of assessment and prognostic significance. World journal of surgery. 1995;19:184–190. - PubMed
-
- Shin K, Fogg VC, Margolis B. Tight junctions and cell polarity. Annual Review of Cell and Developmental Biology. 2006;22:207–235. - PubMed
-
- Weinstein RS, Merk FB, Alroy J. The structure and function of intercellular junctions in cancer. Advances in Cancer Research. 1976;23:23–89. - PubMed
-
- Martin TA, Jiang WG. Loss of tight junction barrier function and its role in cancer metastasis. Biochimica et biophysica acta. 2009;1788:872–891. - PubMed
-
- Guarino M, Rubino B, Ballabio G. The role of epithelial-mesenchymal transition in cancer pathology. Pathology. 2007;39:305–318. - PubMed
Publication types
MeSH terms
Substances
Grants and funding
LinkOut - more resources
Full Text Sources
Other Literature Sources
Medical
Research Materials

