. 2010 Dec 23;5(12):e15732.
doi: 10.1371/journal.pone.0015732.

A novel technique for the in vivo imaging of autoimmune diabetes development in the pancreas by two-photon microscopy

Affiliations

A novel technique for the in vivo imaging of autoimmune diabetes development in the pancreas by two-photon microscopy

Ken Coppieters et al. PLoS One. .

Abstract

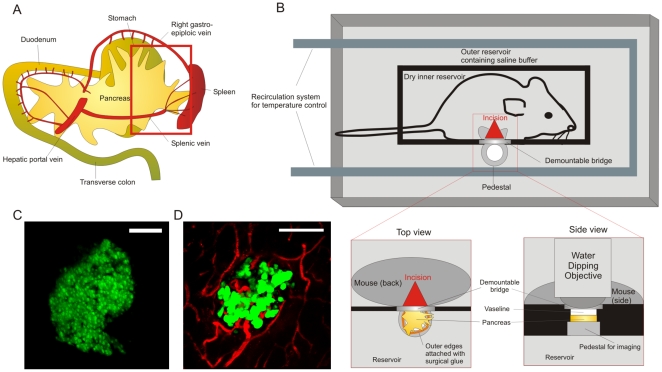
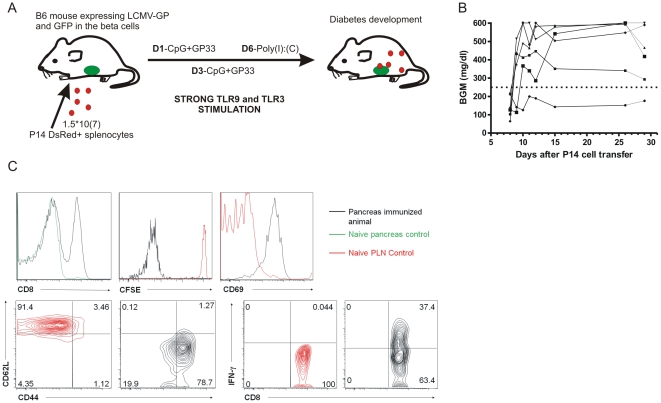
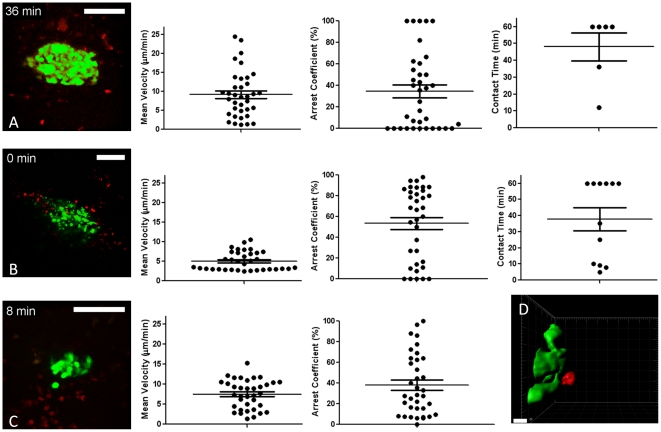
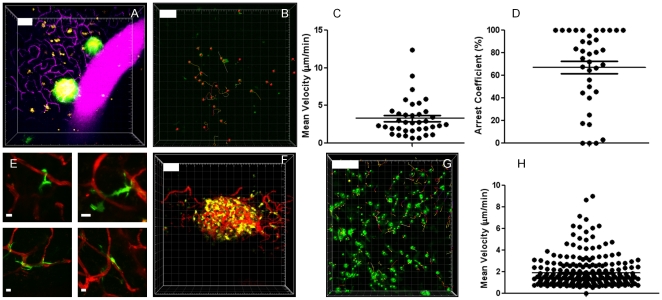
Type 1 diabetes (T1D) is characterized by the immune-mediated destruction of beta cells in the pancreas. Little is known about the in vivo dynamic interactions between T cells and beta cells or the kinetic behavior of other immune cell subsets in the pancreatic islets. Utilizing multiphoton microscopy we have designed a technique that allows for the real-time visualization of diabetogenic T cells and dendritic cells in pancreatic islets in a live animal, including their interplay with beta cells and the vasculature. Using a custom designed stage, the pancreas was surgically exposed under live conditions so that imaging of islets under intact blood pressure and oxygen supply became possible. We demonstrate here that this approach allows for the tracking of diabetogenic leukocytes as well as vascularization phenotype of islets and accumulation of dendritic cells in islets during diabetes pathogenesis. This technique should be useful in mapping crucial kinetic events in T1D pathogenesis and in testing the impact of immune based interventions on T cell migration, extravasation and islet destruction.


Conflict of interest statement

Competing Interests: The authors have declared that no competing interests exist.

Figures

Figure 1
Figure 1. Surgical approach and maintenance of physiologic conditions during intravital imaging of the pancreas.
A. Schematic overview of the anatomical orientation of the pancreas in rodents. In order to gain access to the pancreatic tail region, we cauterized the splenic vessels and performed a splenectomy. The red rectangle indicates the region of the pancreas subjected to imaging. B. Design of a custom-made imaging reservoir for two-photon imaging of the pancreas. The outer reservoir is filled with saline buffer, covers the organ and is continuously maintained between 36.5 and 37 degrees Celcius by a recirculation system. The inner reservoir containing the animal is sealed from the buffer by a barrier (black) and a demountable bridge at the site of the imaging pedestal. To achieve sealing without pressuring the tissue, Vaseline is applied between bridge and pancreas. The pancreatic tail region is gently exposed and its outer edges attached to the pedestal with surgical glue. Finally, the water dipping objective is lowered onto the pancreas for imaging. C. Typical in vivo appearance of a healthy islet, showing coherent beta cell architecture and uniform GFP expression (MIP of 76 z-planes spaced 2 µm; pixel w/h: 1.2 µm; corresponds to Movie S1). D. Islet microvasculature (red) as revealed by intravital imaging after injection of Texas-Red labeled dextran. (MIP of 43 z-planes spaced 5 µm; pixel w/h: 0.6 µm). Scale bars in C and D are 100 µm.
Figure 2
Figure 2. An acute diabetes model suitable for in vivo pancreas imaging.
A. Genetically labeled GP33-specific (‘P14’) splenocytes were adoptively transferred into fluorescent reporter mice harboring green beta cells that express LCMV-GP antigen. The cells were stimulated in vivo by repeated stimulation with peptide, CpG and Poly-IC (TLR ligation). B. These mice develop highly synchronized autoimmune diabetes with clinical onset between day 9–10. BGM: blood glucose measurement C. Pancreatic draining lymph nodes (PLN) and pancreas (PAN) were harvested at time of onset (day 8 post transfer) and stained for the P14 TCR chains Vá2 and Vâ8.1/2, CD8á, CD69, CD44 and CD62L. In conjunction with CFSE dilution and ICCS for IFN-ã, this analysis reveals the influx of highly activated, memory phenotype GP33-specific CD8 T cells around the time of onset. PLN cells from naïve animals were used as controls for comparison since none of the cells homed to the pancreas in the absence of stimulation.
Figure 3
Figure 3. In vivo imaging captures T cell motility and interactions with beta cells in the pancreas.
A. Corresponds to left panel of Movie S3 (MIP from 15 z planes, 11 µm apart, pixel w/h: 0.6 µm). Mean track velocities, arrest coefficients and beta cell contact times were determined after 3D tracking. B. As immune-mediated destruction advances, the GFP signal disintegrates in what appear to be multiple small GFP-containing vesicles (MIP from 15 z planes, 12 µm apart, pixel w/h: 0.9 µm; corresponds to middle panel of Movie S3). Mean track velocities, arrest coefficients and beta cell contact times were determined after 3D tracking. C. Reduced islet size and considerable infiltrate is observed (MIP from 15 z planes, 7.2 µm apart, pixel w/h: 0.5 µm; corresponds to right panel of Movie S3). Only mean track velocities and arrest coefficients were determined as only 1 cell was found to establish prolonged contact with beta cells. D. Isosurface rendition of a T cell (red) in contact with beta cells (green), derived from Movie S4 (left panel). White scale bars are 100 µm, except for D, 10 µm.
Figure 4
Figure 4. Pancreatic dendritic cells constitute a static population in the steady state, but are recruited to the islets under conditions of inflammation.
A. Dendritic cells (yellow) can be seen in the normal pancreas at relatively low densities, in no particular association with the islets (MIP of 35 slices spaced 8 µm apart; pixel w/h: 1.5 µm; corresponds to Movie S5, left panel). Injection of a Texas-Red labeled dextran reveals the dense vascular network (magenta) in the pancreas. Yellowish color of the islets is due to spectral bleedthrough. B,C,D. Tracking of DC in the exocrine pancreas under normal conditions was performed in triplicate (representative experiment in B) and shows low average track velocities (C) and a high portion of cells that virtually arrested during imaging as judged from their arrest coefficients (D). E. Dendritic cells remain in close interaction with the local microvasculature under normal conditions. Images are MIPs spanning total z-volumes of 50 to 70 µm with a step size of 3 to 5 µm. Pixel w/h: 0.3 µm (lower planes), 0.2 and 0.1 µm (upper left and right, resp.). F. Upon diabetes induction, DC accumulate (MIP of 30 planes spaced 6 µm apart; pixel w/h: 1.5 µm; corresponds to Movie S6, middle panel) and completely arrest for prolonged periods of time in dense clusters, wedged in an around the islets. Tracking of CD11c+ cells in the exocrine pancreas showed little motility (G, H) Experiments were performed in triplicate (see 3 panels in Movie S6). The vasculature can be seen in red. White scale bars are 100 µm, except E, 10 µm. All tracking data are representative of duplicate experiments.

Similar articles

Cited by

References

    1. Coppieters K, von Herrath M. Taking a closer look at the pancreas. Diabetologia. 2008;51:2145–2147. - PubMed
    1. von Herrath M, Nepom GT. Animal models of human type 1 diabetes. Nat Immunol. 2009;10:129–132. - PubMed
    1. Coppieters KT, von Herrath MG. Histopathology of type 1 diabetes: old paradigms and new insights. Rev Diabet Stud. 2009;6:85–96. - PMC - PubMed
    1. Denk W, Strickler JH, Webb WW. Two-photon laser scanning fluorescence microscopy. Science. 1990;248:73–76. - PubMed
    1. Miller MJ, Wei SH, Parker I, Cahalan MD. Two-photon imaging of lymphocyte motility and antigen response in intact lymph node. Science. 2002;296:1869–1873. - PubMed

Publication types