. 2010 Dec 23;6(12):e1001255.
doi: 10.1371/journal.pgen.1001255.

A young Drosophila duplicate gene plays essential roles in spermatogenesis by regulating several Y-linked male fertility genes

Affiliations

A young Drosophila duplicate gene plays essential roles in spermatogenesis by regulating several Y-linked male fertility genes

Yun Ding et al. PLoS Genet. .

Abstract

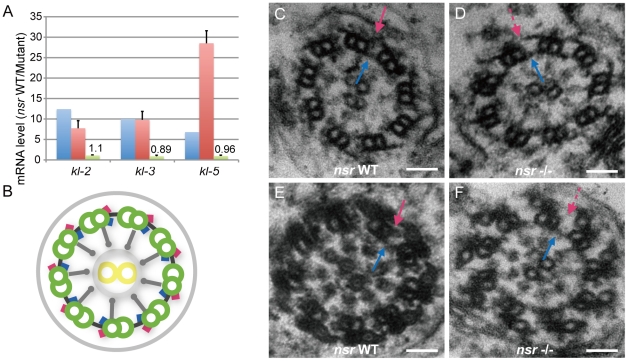
Gene duplication is supposed to be the major source for genetic innovations. However, how a new duplicate gene acquires functions by integrating into a pathway and results in adaptively important phenotypes has remained largely unknown. Here, we investigated the biological roles and the underlying molecular mechanism of the young kep1 gene family in the Drosophila melanogaster species subgroup to understand the origin and evolution of new genes with new functions. Sequence and expression analysis demonstrates that one of the new duplicates, nsr (novel spermatogenesis regulator), exhibits positive selection signals and novel subcellular localization pattern. Targeted mutagenesis and whole-transcriptome sequencing analysis provide evidence that nsr is required for male reproduction associated with sperm individualization, coiling, and structural integrity of the sperm axoneme via regulation of several Y chromosome fertility genes post-transcriptionally. The absence of nsr-like expression pattern and the presence of the corresponding cis-regulatory elements of the parental gene kep1 in the pre-duplication species Drosophila yakuba indicate that kep1 might not be ancestrally required for male functions and that nsr possibly has experienced the neofunctionalization process, facilitated by changes of trans-regulatory repertories. These findings not only present a comprehensive picture about the evolution of a new duplicate gene but also show that recently originated duplicate genes can acquire multiple biological roles and establish novel functional pathways by regulating essential genes.


Conflict of interest statement

The authors have declared that no competing interests exist.

Figures

Figure 1
Figure 1. Evolutionary analysis of kep1 family.
(A) Origination events of the newly originated kep1 gene family. The phylogeny of the Drosophila species and the divergence time are indicated . On the phylogenetic tree, the blue box represents the parental gene kep1, and green and grey boxes represent the intact new genes and pseudogenes of the kep1 family, respectively. The approximate starting point of the origination of the kep1 family is depicted as a red circle. (B) Multiple alignments for protein sequences of kep1 family genes in D. melanogaster. The asterisks denote the positions of identical amino acids. The blue line under the alignment shows the KH RNA-binding domain. (C) Distribution of dN/dS throughout the kep1-nsr pair. With 120-bp windows and 6-bp slides, dN/dS ratios were estimated using the maximum likelihood method and plotted. Blue and red spots represent dN/dS ratios that are statistically significantly lower and higher than the neutral expectation (p-value <0.05, two-tailed Fisher's exact test), respectively. Regions embedded in the KH domain, as depicted by the grey block, are enriched with signals of purifying selection. (D) Likelihood values of nucleotide substitutions for nsr in Drosophila lineages. Numbers of nonsynonymous and synonymous substitutions for the entire coding sequences are labeled above the lineages, and ω values (dN/dS) are labeled beneath the lineages. A ω value representing the lineage that shows significant evidence of positive selection is highlighted in red. Abbreviations: D. melanogaster (mel); D. simulans (sim); D. sechellia (sec); D. yakuba (yak); D. erecta (ere), and D. ananassae (ana).
Figure 2
Figure 2. Expression analysis of kep1 family proteins by GFP transgene in D. melanogaster.
(A–D) Low-magnification fluorescent images of transgenic GFP-fused Kep1 (A), Nsr (B), CG3927 (C), and CG4021 (D) proteins (green) in testes of D. melanogaster strain w1118. All of the kep1 family genes are enriched in the primary spermatocytes. (E–H) High-magnification fluorescent images of transgenic GFP-fused Kep1 (E), Nsr (F), CG3927 (G), and CG4021 (H) proteins in the primary spermatocytes. Proteins of kep1 family genes are located in the nuclear regions of the primary spermatocytes, which are distinguishable from the three diffusely staining nuclear regions (three white arrows), corresponding to the three main chromosome bivalents. Note that all kep1 family proteins are distributed in speckles (yellow arrow). (I and J) Comparisons of subcellular localization between Kep1 and new gene proteins. Kep1 is tagged with GFP (green); while Nsr and CG4021 are tagged with TAP (red), respectively. Nsr protein shows a wider expression region than Kep1 protein (arrow) (I), and CG4021 protein is completely co-localized with Kep1 protein (J). Scale bars: 200 µm for A–D; 10 µm for E–H; 50 µm for I and J.
Figure 3
Figure 3. Generation of null mutants for each kep1 family gene and the male fertility test.
(A) Schematic maps of mutant alleles of kep1 family genes generated by P-element excision or targeted mutagenesis. The exons (black block), start codon (ATG), stop codon (TAA/TGA/TAG), and deleted genomic regions are indicated. For kep1 and CG4021, the P-element insertion for further excision is shown by a triangle, with a Bloomington stock number given underneath. (B) RT-PCR examination of null mutants (Null) for each kep1 family gene relative to WT flies (WT). Negative control (NC) is the reaction without reverse transcriptase, and the expression of rp49 is used as internal control. (C) Fertility test for nsr WT and mutant males. nsr WT: WT controls with identical genetic background with nsr mutants; nsr -/-: homozygous nsr mutants; nsr -/CyO: heterozygous nsr mutants; nsr Rescue: flies with a copy of WT nsr transgene in the nsr mutant background. Error bars indicate standard deviation. (D) Fertility test for kep1, CG3927, and CG4021 WT and mutant (-/-) males. Error bars indicate standard deviation.
Figure 4
Figure 4. Morphological characterization of nsr mutants.
(A and B) Seminal vesicles (sv) from nsr WT (A) and mutant males (B) stained by Hoechst 33342. A shriveled seminal vesicle was observed in nsr mutants. (C and D) dj-GFP labeled elongated spermatids from WT and nsr mutant testes. The elongated spermatids from WT testis (C) are tightly organized in bundles with visible cystic bulges (cb) (arrowhead) and waste bags (wb) (arrow). In contrast, the elongated spermatids from nsr mutants (D) are much looser; the structures of cb and wb can hardly be observed. (E and F) Phalloidin-stained ICs in testes of WT and nsr mutants (inset shows a region at higher magnification). In WT testis, the ICs progress syncytially (E), while the syncytial movement of ICs is abnormal in nsr mutant testis (F). (G and H) Electron microscopic images of cyst from WT and nsr mutant testes at the late stage of individualization (inset shows a region at higher magnification). Individualized spermatids in WT cyst contain highly ordered organelles, including the major mitochondrial derivative (mj), the minor mitochondrial derivative (mi), and the axoneme (ax) (G), while the spermatid individualization is abolished in the nsr mutant cyst, as revealed by excess cytoplasmic remnants (arrow) and poorly assembled organelles (H). (I and J) Testis bases of WT and nsr mutant flies under a phase contrast microscope. Unlike regular coiling in the WT flies (I), the spermatids are tangled at the testis base of nsr mutant (J). Scale bars: 200 µm for A–D; 100 µm for E and F; 1 µm for G and H.
Figure 5
Figure 5. Identification of the Y chromosome genes kl-2, kl-3, and kl-5 as downstream targets of nsr.
(A) Histogram of kl-2, kl-3, and kl-5 RNA level changes in testes of nsr mutants for mature transcripts, estimated by RNA-Seq (blue) and quantitative real-time PCR (red), and for primary transcripts estimated by quantitative real-time PCR (green). Error bars indicate standard deviation. Both RNA-Seq and real-time PCR results show that the mature transcripts are down-regulated in the mutant testes. The difference between the estimations of kl-5 by RNA-Seq and real-time PCR is possibly due to the larger variations of genes with lower abundance in RNA-Seq . The real-time PCR result shows that the levels of primary transcripts are largely unaltered between the WT and mutant testes. (B) Graphic illustration of axoneme structure , . The axoneme is composed of a central pair of singlet microtubules (yellow circle) surrounded by nine doublet microtubules (green circle), anchored by outer (red) and inner (blue) dynein arms that can mediate axoneme motility. Radical spokes (grey spoke) pass from each doublet fiber toward the central singlets. (C–F) Electron microscopic images of early- (C and D) and late-stage (E and F) spermatid axonemes for WT and nsr mutants. The late-stage axoneme is distinct from early-stage axoneme by extensive accessory structures. For both stages, the inner dynein arms of the axoneme are normal in nsr mutants (blue arrow), but the outer dynein arms (red arrow) are constantly missing (dashed red arrow). Scale bars: 50 nm.
Figure 6
Figure 6. Evolutionary history of the expression patterns of kep1 family proteins.
(A) Phylogenetic tree of Drosophila species. The pre- and post-duplication lineages are denoted by blue lines and red lines, respectively. (B–F) Immunostaining of testes with different genotypes using Kep1 antibody shows fluorescent signals in primary spermatocytes for the D. melanogaster species complex (B, E and F) but only background staining for the pre-duplication species D. yakuba (D). This suggests that the primary spermatocyte-biased expression patterns of kep1 family genes should have been established in the common ancestor of the D. melanogaster species complex after the split of D. yakuba. (G) Transgenic GFP, regulated by cis-elements (including promoter, 5′ UTR and coding sequences) of D. yakuba kep1 in D. melanogaster, is also enriched in primary spermatocytes, indicating that the cis-elements of kep1 have not changed between D. melanogaster and D. yakuba, and thus, trans-regulatory changes should have contributed to the observed testicular expression patterns of kep1 family genes in D. melanogaster. The abbreviations of Drosophila species are the same as in Figure 1. Scale bars: 200 µm.

References

    1. Ohno S. New York: Springer-Verlag; 1970. Evolution by gene duplication.
    1. Zhou Q, Wang W. On the origin and evolution of new genes–a genomic and experimental perspective. J Genet Genomics. 2008;35:639–648. - PubMed
    1. Long M, Betran E, Thornton K, Wang W. The origin of new genes: glimpses from the young and old. Nat Rev Genet. 2003;4:865–875. - PubMed
    1. Lynch M, Force A. The probability of duplicate gene preservation by subfunctionalization. Genetics. 2000;154:459–473. - PMC - PubMed
    1. Lynch M, Conery JS. The evolutionary fate and consequences of duplicate genes. Science. 2000;290:1151–1155. - PubMed

Publication types

MeSH terms

Substances