. 2010 Dec 21;8(12):e1000565.
doi: 10.1371/journal.pbio.1000565.

Prox1 regulates the notch1-mediated inhibition of neurogenesis

Affiliations

Prox1 regulates the notch1-mediated inhibition of neurogenesis

Valeria Kaltezioti et al. PLoS Biol. .

Abstract

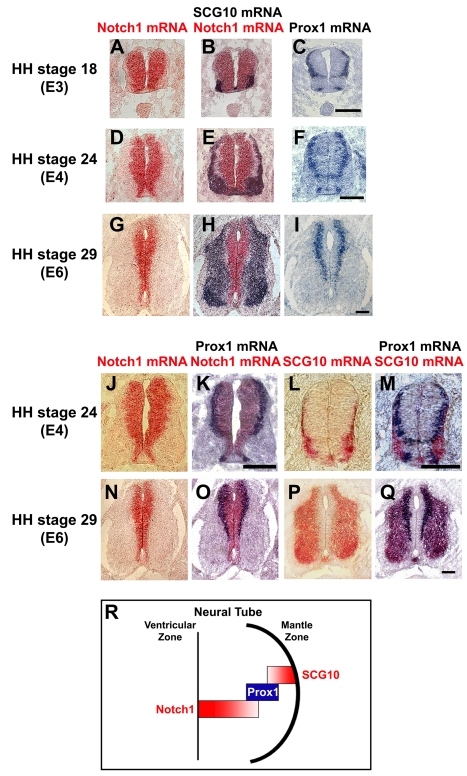
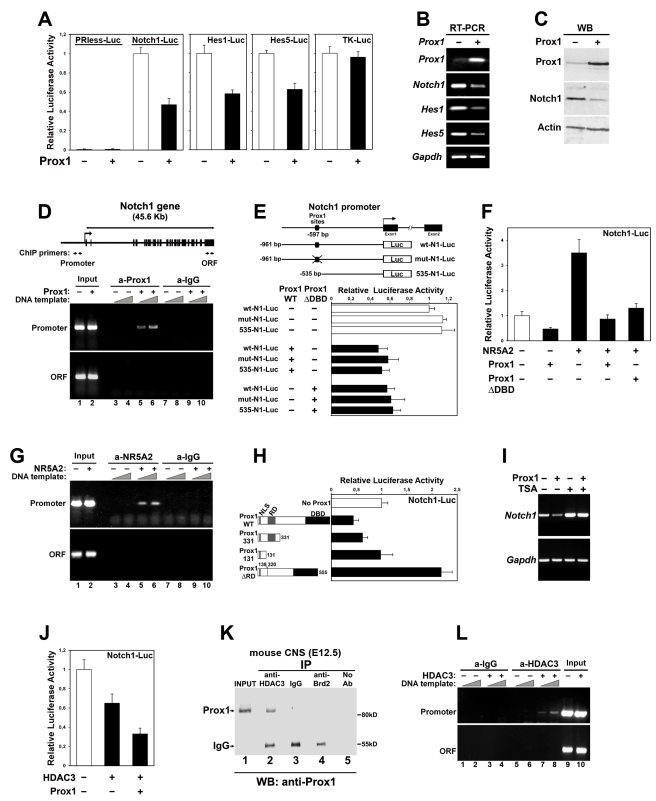
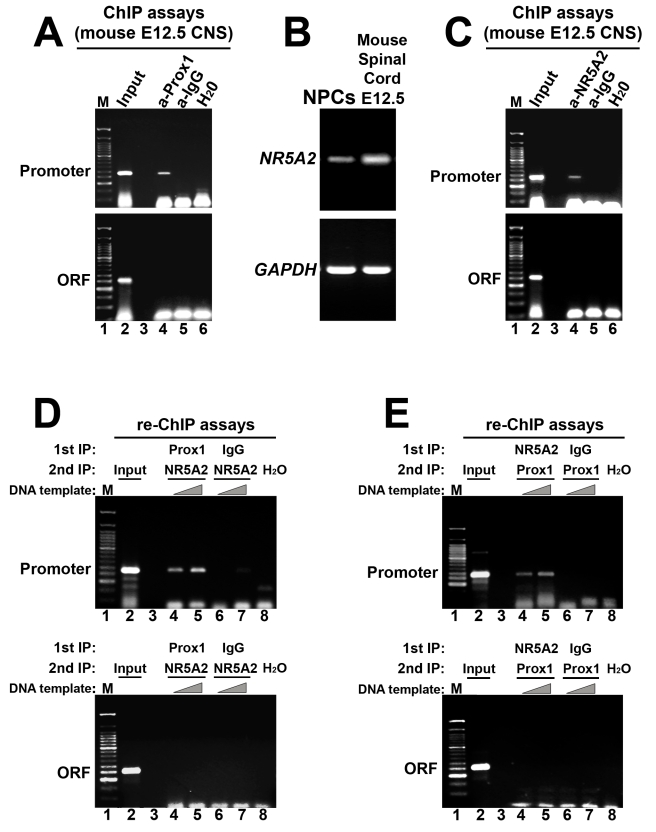
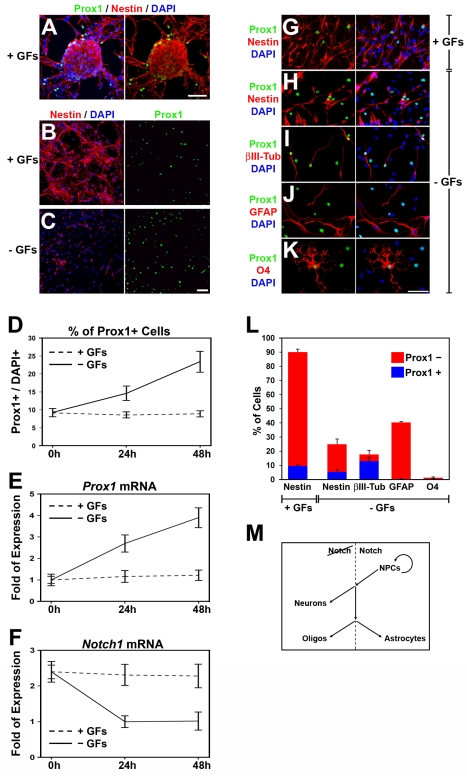
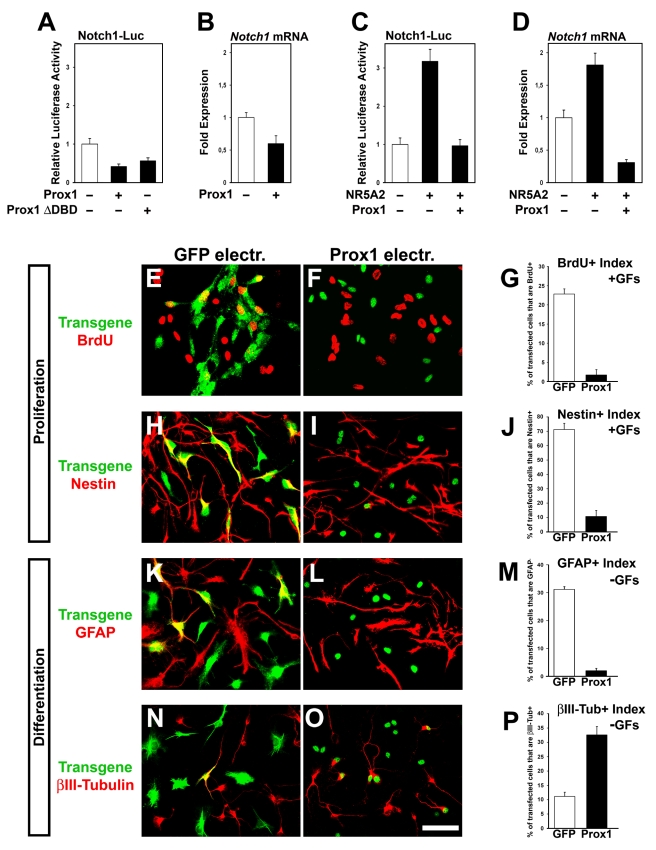
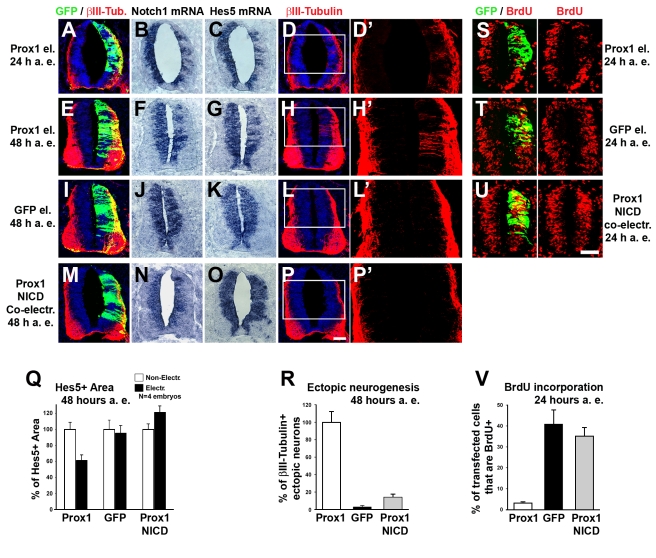
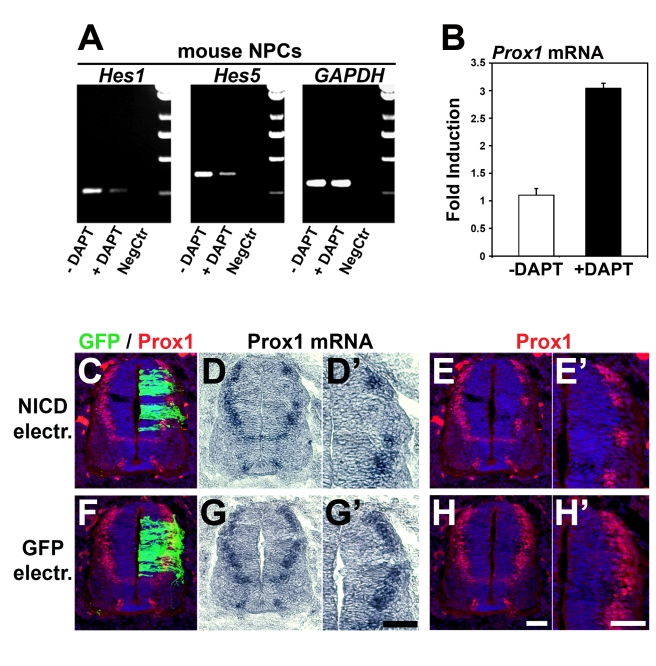
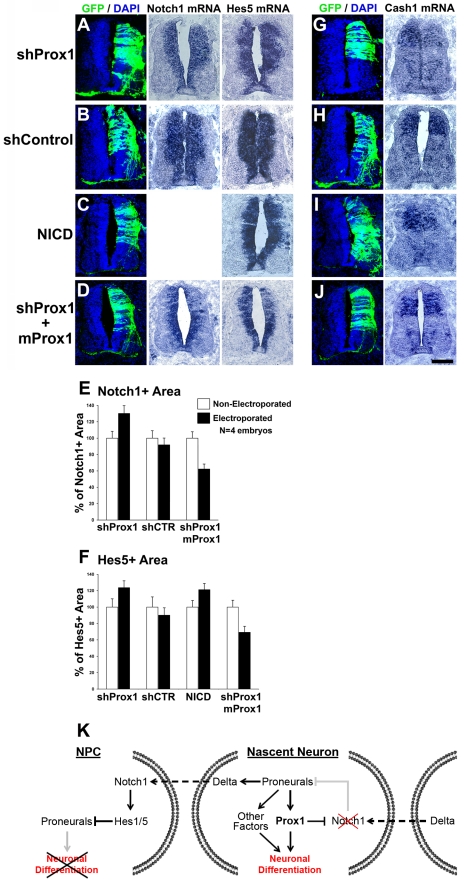
Activation of Notch1 signaling in neural progenitor cells (NPCs) induces self-renewal and inhibits neurogenesis. Upon neuronal differentiation, NPCs overcome this inhibition, express proneural genes to induce Notch ligands, and activate Notch1 in neighboring NPCs. The molecular mechanism that coordinates Notch1 inactivation with initiation of neurogenesis remains elusive. Here, we provide evidence that Prox1, a transcription repressor and downstream target of proneural genes, counteracts Notch1 signaling via direct suppression of Notch1 gene expression. By expression studies in the developing spinal cord of chick and mouse embryo, we showed that Prox1 is limited to neuronal precursors residing between the Notch1+ NPCs and post-mitotic neurons. Physiological levels of Prox1 in this tissue are sufficient to allow binding at Notch1 promoter and they are critical for proper Notch1 transcriptional regulation in vivo. Gain-of-function studies in the chick neural tube and mouse NPCs suggest that Prox1-mediated suppression of Notch1 relieves its inhibition on neurogenesis and allows NPCs to exit the cell cycle and differentiate. Moreover, loss-of-function in the chick neural tube shows that Prox1 is necessary for suppression of Notch1 outside the ventricular zone, inhibition of active Notch signaling, down-regulation of NPC markers, and completion of neuronal differentiation program. Together these data suggest that Prox1 inhibits Notch1 gene expression to control the balance between NPC self-renewal and neuronal differentiation.


Conflict of interest statement

The authors have declared that no competing interests exist.

Figures

Figure 1
Figure 1. Comparison of spatiotemporal expression patterns of Prox1, Notch1, and SCG10 genes in early embryonic chick spinal cord.
(A–I) Double in situ hybridizations with Notch1 (red) and SCG10 (blue) on sections from HH stages 18 (A–B), 24 (D–E), and 29 (G–H), and comparison with Prox1 (C, F, and I) single in situ hybridizations on adjacent sections. The sections were from the thoracic level of spinal cord. (J–Q) Double in situ hybridizations with Notch1 (red) and Prox1 (blue) on sections from HH stages 24 (J–K, thoracic level) and 29 (N–O, thoracic level), and double in situ hybridizations with SCG10 (red) and Prox1 (blue) on sections from HH stages 24 (L–M, cervical level) and 29 (P–Q, thoracic level). Scale bars: 100 µm. (R) Schematic representation of the Prox1 expression pattern in neural tube during early embryonic development.
Figure 2
Figure 2. Prox1-mediated transcriptional repression of the Notch1 gene promoter in N2A cells is facilitated by NR5A2 and HDAC3.
(A) Transcriptional assays in N2A co-transfected with a Prox1 expression plasmid and luciferase reporter constructs containing human Notch1, mouse Hes1, mouse Hes5, or human thymidine kinase promoters, as well as empty vector (PRless). In all luciferase experiments shown in this figure, data are represented as the mean ± SD of quadruplicate assays. In all cases p<0.01, except TK-Luc and PRless, p>0.1. (B–C) RT-PCR (B) and Western blot (C) analysis of Prox1 overexpression in N2A, for Prox1, Notch1, Hes1, Hes5, and Gapdh genes (B), and Prox1, Notch1, and Actin proteins (C), as indicated. (D) ChIP analysis of the binding of Prox1 to Notch1 promoter in N2A transiently transfected with a Prox1 construct or a control empty vector. The organization of the Notch1 gene is schematically represented in the top panel. Exons are represented as black boxes. The primer pairs used to amplify the corresponding DNA sequences are indicated with arrows below the schematic drawing. (E) Transcriptional assays in N2A co-transfected with WT Prox1, ΔDBD Prox1, or empty vector, and WT Notch1-luc, mut-Notch1-Luc, or 535-Notch1-Luc reporter constructs. Schematic of the Notch1 promoter and corresponding mutations are indicated in the top of the panel. In all cases p<0.01. (F) Transcriptional assays in N2A co-transfected with WT Notch1-Luc construct and various combinations of expression vectors, as indicated. p<0.01 for NR5A2 alone versus NR5A2/Prox1, and NR5A2 alone versus NR5A2/ΔDBD-Prox1. (G) ChIP analysis of the binding of NR5A2 to Notch1 promoter in N2A cells transfected with a NR5A2 construct or a control empty vector. (H) Transcriptional assays in N2A co-transfected with Notch1-Luc construct and various deletion constructs for Prox1. Schematic of the Prox1 deletion constructs is presented in the left of the panel. Grey box indicates the RD domain, and black box indicates the DBD domain. In all cases p<0.01, except 331-Prox1 versus No-Prox1, p<0.05; 131-Prox1 versus No-Prox1, p>0.1. (I) RT-PCR analysis of Prox1 overexpression in N2A, treated with 150 nM TSA or vehicle alone, for endogenous Notch1 and Gapdh genes, as indicated. (J) Transcriptional assays in N2A co-transfected with Notch1-Luc construct and HDAC3 expression vector in the presence or absence of Prox1. p<0.05 for WT versus HDAC3; p<0.01 for WT versus HDAC3+Prox1; p<0.05 for HDAC alone versus HDAC3+Prox1. (K) Prox1 binds HDAC3 in vivo. Cell lysates from mouse embryonic CNS (E12.5) were subjected to immunoprecipitations with anti-HDAC3 antibody, control anti-rabbit IgGs, or control anti-Brd2 antibody, followed by immunoblotting with anti-Prox1 antibody. The positions of Prox1 and heavy chain of IgGs are shown on the left. (L) ChIP analysis of the binding of HDAC3 to Notch1 promoter in N2A transfected with a HDAC3 construct or a control empty vector.
Figure 3
Figure 3. Prox1 and NR5A2 interact in vivo with the promoter of Notch1 gene.
(A) ChIP analysis of the binding of Prox1 to proximal Notch1 promoter in chromatin prepared from the CNS of E12.5 mouse embryos. The primer pairs used to amplify the corresponding DNA sequences are indicated with arrows below the schematic drawing in Figure 2D. (B) RT-PCR analysis in NPCs cultured in vitro, and E12.5 mouse spinal cords, for the detection of NR5A2 and Gapdh mRNAs, as indicated. (C) ChIP analysis of the binding of NR5A2 to proximal Notch1 promoter in chromatin prepared from the CNS of E12.5 mouse embryos. (D–E) Re-ChIP experiments were performed in the CNS of E12.5 mouse embryos on the Notch1 promoter (top panels) and compared with the 3′ Notch1 coding sequence (ORF, lower panels) using anti-Prox1, anti-NR5A2, or control antibodies in a serial manner. The antibodies used in each round of precipitation are indicated in the top of each panel. The primer pairs used to amplify the corresponding DNA sequences are indicated with arrows below the schematic drawing in Figure 2D.
Figure 4
Figure 4. Prox1 is expressed in mouse NPCs cultured in vitro and up-regulated upon differentiation.
(A–C) Double Prox1/Nestin immunostainings of NPCs isolated from mouse spinal cords of E14.5 embryos, and cultured in vitro, either as neurospheres (A) or dissociated cells (B–C), in the presence (A–B) or absence of GFs (C). Scale bar: 50 µm. (D) Quantification of Prox1+ cells in NPCs cultured in the presence (dotted line) or absence (solid line) of GFs. The number of Prox1+ cells is expressed as percentage of the total number of DAPI+ cells. (E–F) Relative expression levels of Prox1 (E) and Notch1 (F) mRNA in NPCs cultured in the presence (dotted line) or absence (solid line) of GFs, measured with quantitative real time RT-PCR. (G–L) Double immunostainings of NPCs with Prox1 (green) and various markers (red), as indicated, cultured in the presence (G) or absence of GFs (H–K). Scale bar: 50 µm. Quantification of Prox1+ (blue) or Prox1− (red) cells is shown in (L). (M) Schematic representation of the role of active Notch signaling in regulating self-renewal and differentiation of NPCs.
Figure 5
Figure 5. Forced expression of Prox1 in mouse NPCs suppresses progenitor identity, inhibits astrocyte differentiation, and induces neurogenesis.
(A–D) Relative luciferase activities (A and C) and mRNA levels (B and D) were measured in NPCs transfected with various constructs as indicated. (E–G) Double GFP or Flag/BrdU immunostainings of NPCs in the presence of GFs and electroporated with GFP (E) or Prox1 (F) expression vectors. In all panels of this figure, expression of transgenes was detected with anti-GFP or anti-Flag antibodies, respectively. Quantification of BrdU index is shown in (G). p<0.001. (H–J) Double GFP or Flag/Nestin immunostainings of NPCs cultured in the presence of GFs and electroporated with GFP (H) or Prox1 (I) expression vectors. Quantification of Nestin index is shown in (J) p<0.001. (K–M) Double GFP or Flag/GFAP immunostainings of NPCs cultured in the absence of GFs and electroporated with GFP (K) or Prox1 (L) expression vectors. Quantification of GFAP index is shown in (M) p<0.001. (N–P) Double GFP or Flag/βIII-tubulin immunostainings of NPCs cultured in the absence of GFs and electroporated with GFP (N) or Prox1 (O) expression vectors. Quantification of βIII-tubulin index is shown in (P) p<0.01. For all panels scale bar: 50 µm.
Figure 6
Figure 6. Misexpression of Prox1 in vivo suppresses Notch1 gene expression to induce early neuronal differentiation.
(A–P) Double GFP/βIII-tubulin immunostainings (A, D, E, H, I, L, M, and P) and in situ hybridizations for Notch1 (B, F, J, and N) and Hes5 (C, G, K, and O) in consecutive sections, 24 h a. e. (A–D) or 48 h a.e. (E–P) with Prox1/GFP (A–H), GFP alone (I–L), or co-electroporation with Prox1/GFP and NICD (M–P). (D'), (H'), (L'), and (P') micrographs are larger magnifications of the white rectangle in (D), (H), (L), and (P), respectively. Scale bar: 50 µm. (Q) Quantitative analysis of the Hes5+ area presented in (G), (K), and (O) using the ImageJ software. The data are presented as % of non-electroporated side. For Prox1 versus GFP alone, p<0.01. For Prox1+NICD versus GFP alone, p<0.05. For Prox1+NICD versus Prox1, p<0.01. All cases referred to the electroporated side. (R) Percentage of ectopic βIII-tubulin+ neurons per embryo (10 sections per embryo; n = 4 embryos). The data are presented as % of Prox1 electroporated embryos. p<0.001 for Prox1 versus GFP; p<0.001 for Prox1 versus Prox1+NICD. (S–U) Double GFP/BrdU immunostainings 24 h a.e. with Prox1/GFP (S), GFP alone (T), or co-electroporation with Prox1/GFP and NICD (U), followed by 2-h BrdU pulse. Scale bar: 50 µm. (V) Quantitative analysis of BrdU incorporation. The number of BrdU+ transfected cells 24 h a.e. is expressed as percentage of the total number of transfected cells (n = 5 embryos; p<0.001 for Prox1 versus GFP; p<0.001 for Prox1 versus Prox1+NICD).
Figure 7
Figure 7. Active Notch1 signaling suppresses Prox1 gene expression.
(A–B) RT-PCR analysis of NPCs cultured in the presence or absence of DAPT, for Hes1, Hes5, Gapdh (A), and Prox1 (B) genes, as indicated. For Prox1 mRNA, p<0.01, n = 3. (C–H') Double GFP/Prox1 immunostainings and in situ hybridizations for Prox1 in consecutive sections, as indicated, 48 h a.e. with NICD/GFP (C–E') or GFP alone (F–H'). (D'), (E'), (G'), and (H') micrographs are larger magnifications of the electroporated area in (D), (E), (G), and (H), respectively. Scale bar: 50 µm.
Figure 8
Figure 8. shRNA-mediated inhibition of Prox1 expression in chick spinal cord enhances expression of Notch1 and Hes5 genes and impairs neurogenesis.
(A–D) GFP/DAPI stainings and in situ hybridizations for Notch1 and Hes5 in consecutive sections 48 h a.e. with shProx1 (A), shControl (B), NICD+GFP (C), or shProx1+mProx1 (D). (E–F) Quantitative analysis of the Notch1+ (E) and Hes5+ (F) areas presented in (A–D) using the ImageJ software. The data are presented as % of non-electroporated side of the spinal cord. For Notch1+ area (E), shProx1 versus shControl, p<0.01; shProx1 versus shProx1+mProx1, p<0.01, n = 4 embryos. For Hes5+ area (F), shProx1 versus shControl, p<0.05; shProx1 versus NICD, p>0.1; shProx1 versus shProx1+mProx1, p<0.01, n = 4 embryos. All cases referred to the electroporated side. (G–J) GFP/DAPI stainings and in situ hybridization for Cash1 in consecutive sections 48 h a.e. with shProx1 (G), shControl (H), NICD/GFP (I), or shProx1+mProx1 (J). Scale bar: 100 µm. (K) Schematic representation of the role of Prox1-mediated suppression of Notch1 expression in neuronal differentiation. During neurogenic phase of CNS development, NPCs divide asymmetrically to produce one NPC and one neuronal precursor/nascent neuron. In NPC, active Notch1 signaling prevents neuronal differentiation via direct inhibition of proneural genes. In nascent neurons, proneural genes activate Prox1 to suppress Notch1 gene expression and thus prevent activation of Notch1 receptor from neighboring signal-sending cells and sustain the program for neuronal differentiation. Moreover, Prox1-mediated inhibition of Notch1 may also block the inhibitory action of active Notch1 signaling on the expression of proneural genes, thus generating a positive feedback loop to maintain proneural gene expression and further enhance neuronal differentiation.

References

    1. Kageyama R, Ohtsuka T, Shimojo H, Imayoshi I. Dynamic Notch signaling in neural progenitor cells and a revised view of lateral inhibition. Nat Neurosci. 2008;11:1247–1251. - PubMed
    1. Louvi A, Artavanis-Tsakonas S. Notch signalling in vertebrate neural development. Nat Rev Neurosci. 2006;7:93–102. - PubMed
    1. Yoon K, Gaiano N. Notch signaling in the mammalian central nervous system: insights from mouse mutants. Nat Neurosci. 2005;8:709–715. - PubMed
    1. Selkoe D, Kopan R. Notch and Presenilin: regulated intramembrane proteolysis links development and degeneration. Annu Rev Neurosci. 2003;26:565–597. - PubMed
    1. Bertrand N, Castro D. S, Guillemot F. Proneural genes and the specification of neural cell types. Nat Rev Neurosci. 2002;3:517–530. - PubMed

Publication types

MeSH terms