

Sensitized phenotypic screening identifies gene dosage sensitive region on chromosome 11 that predisposes to disease in mice
- PMID: 21204268
- PMCID: PMC3402001
- DOI: 10.1002/emmm.201000112
Sensitized phenotypic screening identifies gene dosage sensitive region on chromosome 11 that predisposes to disease in mice
Abstract
The identification of susceptibility genes for human disease is a major goal of current biomedical research. Both sequence and structural variation have emerged as major genetic sources of phenotypic variability and growing evidence points to copy number variation as a particularly important source of susceptibility for disease. Here we propose and validate a strategy to identify genes in which changes in dosage alter susceptibility to disease-relevant phenotypes in the mouse. Our approach relies on sensitized phenotypic screening of megabase-sized chromosomal deletion and deficiency lines carrying altered copy numbers of ∼30 linked genes. This approach offers several advantages as a method to systematically identify genes involved in disease susceptibility. To examine the feasibility of such a screen, we performed sensitized phenotyping in five therapeutic areas (metabolic syndrome, immune dysfunction, atherosclerosis, cancer and behaviour) of a 0.8 Mb reciprocal chromosomal duplication and deficiency on chromosome 11 containing 27 genes. Gene dosage in the region significantly affected risk for high-fat diet-induced metabolic syndrome, antigen-induced immune hypersensitivity, ApoE-induced atherosclerosis, and home cage activity. Follow up studies on individual gene knockouts for two candidates in the region showed that copy number variation in Stat5 was responsible for the phenotypic variation in antigen-induced immune hypersensitivity and metabolic syndrome. These data demonstrate the power of sensitized phenotypic screening of segmental aneuploidy lines to identify disease susceptibility genes.
Copyright © 2011 EMBO Molecular Medicine.
Figures
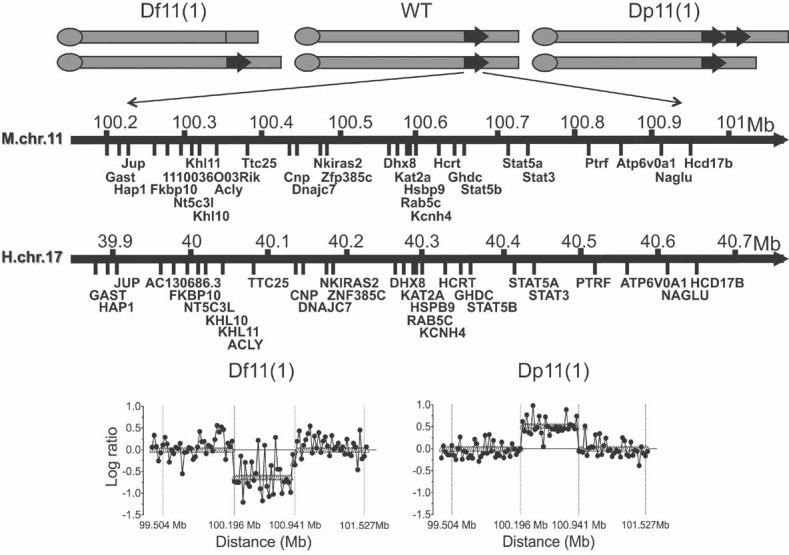
Schematic representation of the segmental aneuploidy region on chromosome 11 containing 26 annotated and one unknown gene (mouse NCBI m37 assembly, April 2007, C57BL/6J reference strain) and syntenic region on human chromosome 17 (Human GRCh37 assembly February 2009). Df11(1)/+, WT and Dp11(1)/+ mice carried one, two and three copies, respectively, of genes in the interval.
CGH analysis of Df11(1)/+ versus WT and Dp11(1)/+ versus WT littermates confirmed expected gene dose changes across the rearrangement. Negative and positive log ratios indicate, respectively, loss and gain of genetic material.
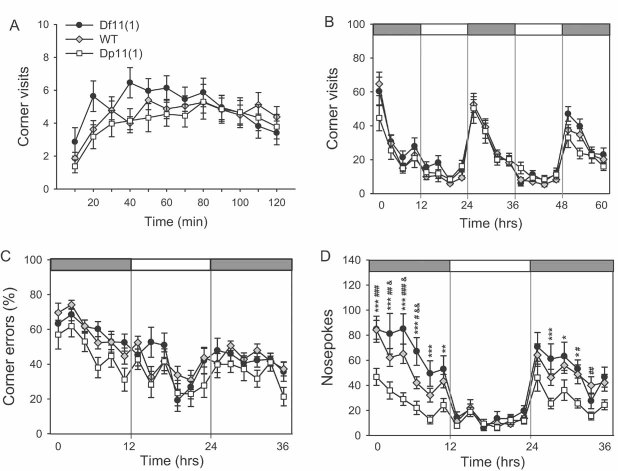
A significant gene dose-dependent effect was observed for number of corner visits during the first 2 h after being placed in the monitoring apparatus (10 min intervals; mean ± SEM; Df11(1)/+, N = 22; WT, N = 45; Dp11(1)/+, N = 33).
No significant genotype effect on general day/night activity (number of corner visits) of animals was observed (3 h intervals; mean ± SEM; Df11(1)/+, N = 22; WT, N = 41; Dp11(1)/+, N = 24).
Significant gene dosage effect was observed on percentage of incorrect visits (2 h intervals). Dark and light phases are indicated by the dark and light bars, respectively (mean ± SEM; Df11(1)/+, N = 22; WT, N = 41; Dp11(1)/+, N = 24).
Significant gene dosage-dependent effect is observed on total numbers of nose pokes to incorrect corners (2 h intervals; mean ± SEM; Df11(1)/+, N = 22; WT, N = 41; Dp11(1)/+, N = 24; *Dp vs. Df, # Dp vs. WT and Df vs. WT; *p < 0.05, **p < 0.01, ***p < 0.001).
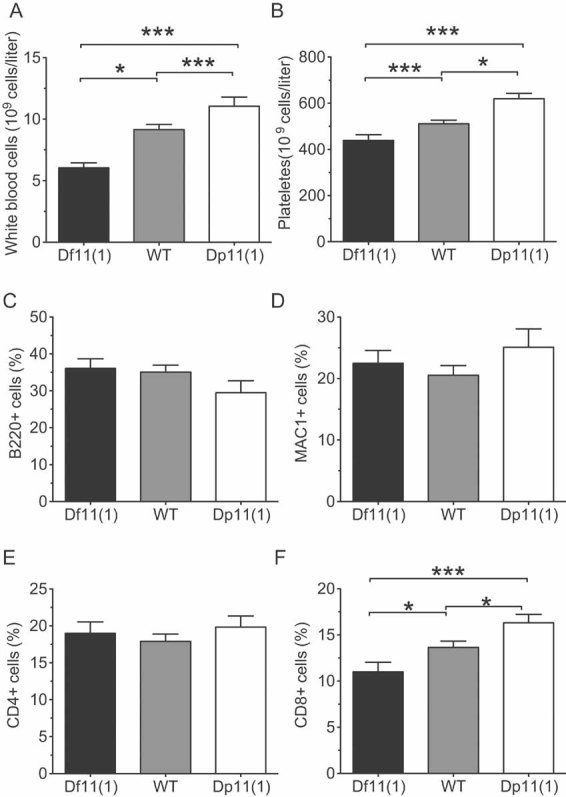
A,B. A significant positive gene dose-dependent effect was observed for (A) white blood cells, and (B) platelet counts at 12 weeks of age (mean ± SEM; Df11(1)/+, N = 21; WT, N = 41; Dp11(1)/+, N = 20; *P < 0.05, **P < 0.01, ***P < 0.001).
C–F. Flow cytometry revealed a significant positive gene dose-dependent effect for percentage (F) CD8+, but not (C) B220+, (D) Mac1+, (E) CD4+ positive cells in peripheral blood (mean ± SEM; Df11(1)/+, N = 19; WT, N = 58; Dp11(1)/+, N = 25; *P < 0.05, **P < 0.01).
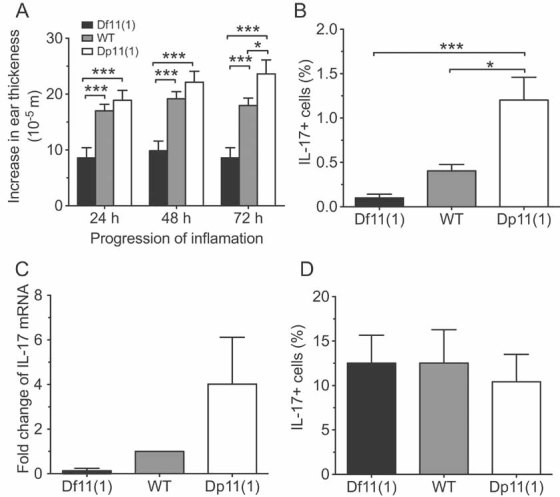
A significant positive gene dose-dependent effect was observed for ear swelling following local application of DNFB. Ear thickness was measured at 24, 48 and 72 h following DNFB treatment in mice that had been sensitized by DNFB pre-treatment (mean ± SEM; Df11(1)/+, N = 22; WT, N = 42; Dp11(1)/+, N = 20; *p < 0.05, ***p < 0.001).
A significant positive gene dose-dependent effect was observed for the fraction of cultured naïve splenic T cells (Th0 cells) immunostaining for intracellular IL-17 (N = 4).
Quantitative real-time PCR revealed a positive gene dose-dependent effect on IL-17 mRNA expression in Th0 cells cultured for 5 days and stimulated acutely with cytokines. Data represents fold change compared to WT animals. N = 2 for each genotype.
The gene dose-dependent effect on fraction of IL-17+ T cells was occluded in cytokine-induced polarized T cells (Th17 cells, mean ± SEM, N = 4).
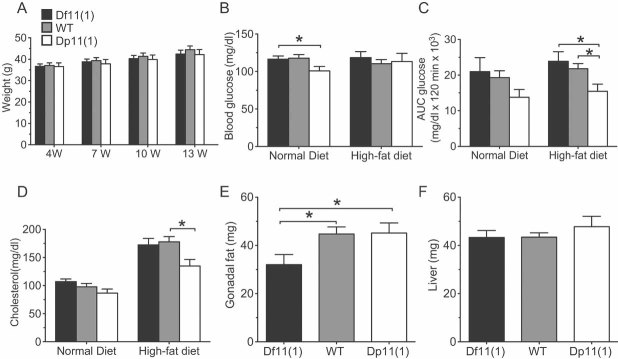
A. Normal body weight in Df11(1)/+ and Dp11(1)/+ mice 4, 7, 10 and 13 weeks after initiation of high-fat diet (mean ± SEM; Df11(1)/+, N = 14; WT, N = 18; Dp11(1)/+ N = 11).
B. Significant negative gene dose-dependent effect on fasted blood glucose concentration in mice on normal (week 15), but not after 15 weeks of high-fat diet treatment (week 30).
C. Significant negative gene dose-dependent effect on glucose clearance following intra-peritoneal dextrose challenge after high-fat diet treatment for 15 weeks (AUC = area under the curve; Df11(1)/+, N = 20; WT, N = 36; Dp11(1)/+, N = 15 Controls were age-matched mice on a normal diet: Df11(1)/+, N = 7; WT, N = 19; Dp11(1)/+, N = 11 *p < 0.05).
D. Significant negative gene dose-dependent effect on plasma cholesterol in mice treated for 15 weeks with high-fat (week 30), but not normal diet (week 14 mean ± SEM; Df11(1)/+, N = 23; WT, N = 49; Dp11(1)/+, N = 22).
E,F. Significant positive gene dose-dependent effect on normalized (E) gonadal fat, but not (F) liver weight (mean ± SEM; Df11(1)/+, N = 20; WT, N = 35; Dp11(1)/+, N = 15). Weight of Gonadal fat and liver for each animal were normalized to total body weight.
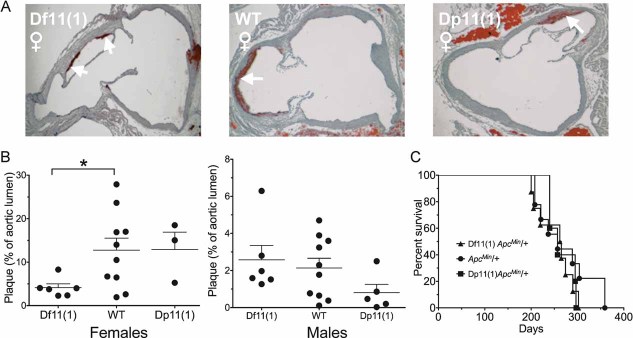
A. Representative histological sections of proximal aorta showing significant staining of plaque material (red, indicated by arrows) in all genotypes. Opposite gene dose-dependent effects on relative area of aortic plaques were seen in females (Df11(1)/+, N = 6; WT, N = 10; Dp11(1)/+, N = 3) and males (Df11(1)/+, N = 6; WT, N = 10; Dp11(1)/+, N = 5). In females, Df11(1)/+ mice showed significantly smaller plaques that WT mice, whereas in males, Df11(1)/+ mice showed a trend for increased plaque size compared to Dp11(1)/+ mice (mean ± SEM, *p < 0.05).
C. Kaplan–Meier survival plot of ApcMin/+ animals with Df11(1) or Dp11(1) alleles and their WT littermates. No gene dose-dependent moderation of survival in ApcMin/+ mice was observed. (Df11(1)/+; ApcMin/+, N = 7; +/+; ApcMin/+, N = 9; Dp11(1)/+; ApcMin/+, N = 5).
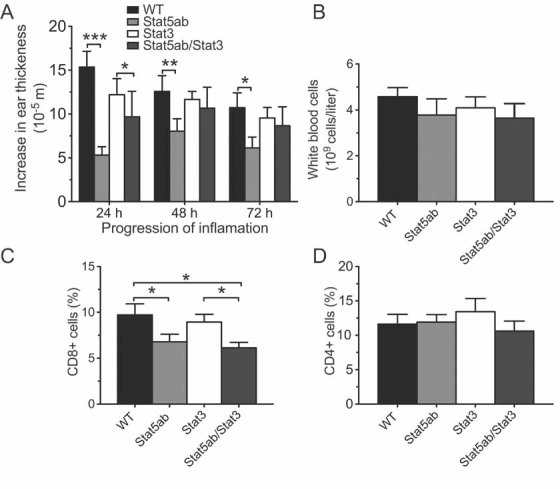
A. A significant reduction of ear swelling was observed in heterozygous Stat5abKO, but not Stat3KO mice following local application of DNFB. Ear thickness was measured at 24, 48 and 72 h following DNFB treatment in mice that had been sensitized by DNFB pre-treated on the abdomen 5 days earlier (mean ± SEM; WT, N = 15; Stat5abKO/+, N = 13; Stat3KO/+, N = 10; Stat5abKO/Stat3KO, N = 6; *p < 0.05, **p < 0.01, ***p < 0.001).
B–D. Significant reduction in peripheral blood (C) CD8+, but not (D) CD4+ T cells or (B) total white blood cells (mean ± SEM; WT, N = 9; Stat5abKO/+, N = 9; Stat3KO/+, N = 7; Stat5abKO/Stat3KO, N = 6; *p < 0.05, **p < 0.01, ***p < 0.001).
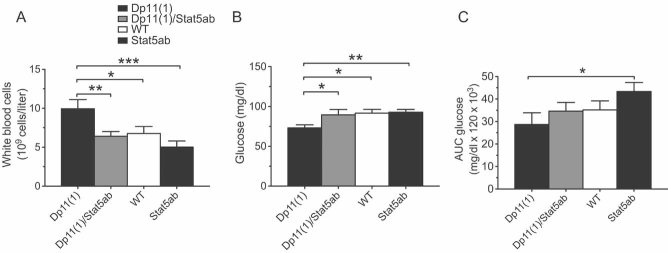
A,B. The significant (A) increase in total white blood cells and (B) decrease in baseline glucose seen in Dp11(1)/+ mice compared to WT mice was reversed in Dp11(1)/+;Stat5abKO/+ double mutant littermates (Dp11(1), N = 7; Dp11(1)/Stat5ab, N = 9; WT, N = 10; Stat5ab, N = 8).
C. The trend for increased glucose tolerance seen in Dp11(1)/+ mice compared to WT mice was reversed in Dp11(1)/+;Stat5abKO/+ double mutant littermates (Dp11(1), N = 7; Dp11(1)/Stat5ab, N = 9; WT, N = 14; Stat5ab, N = 7; mean ± SEM, *p < 0.05, **p < 0.01, ***p < 0.001).
Comment in
-
Copy number variation and susceptibility to complex traits.EMBO Mol Med. 2011 Jan;3(1):1-4. doi: 10.1002/emmm.201000111. Epub 2010 Dec 23. EMBO Mol Med. 2011. PMID: 21204264 Free PMC article.
References
-
- Adams DJ, Biggs PJ, Cox T, Davies R, van der Weyden L, Jonkers J, Smith J, Plumb B, Taylor R, Nishijima I, et al. Mutagenic insertion and chromosome engineering resource (MICER) Nat Genet. 2004;36:867–871. - PubMed
Publication types
MeSH terms
Substances
LinkOut - more resources
Full Text Sources
Molecular Biology Databases
Miscellaneous
