. 2011 Apr 1;10(4):1583-92.
doi: 10.1021/pr100952f. Epub 2011 Feb 17.

Peptidomic analysis of human cell lines

Affiliations

Peptidomic analysis of human cell lines

Julia S Gelman et al. J Proteome Res. .

Abstract

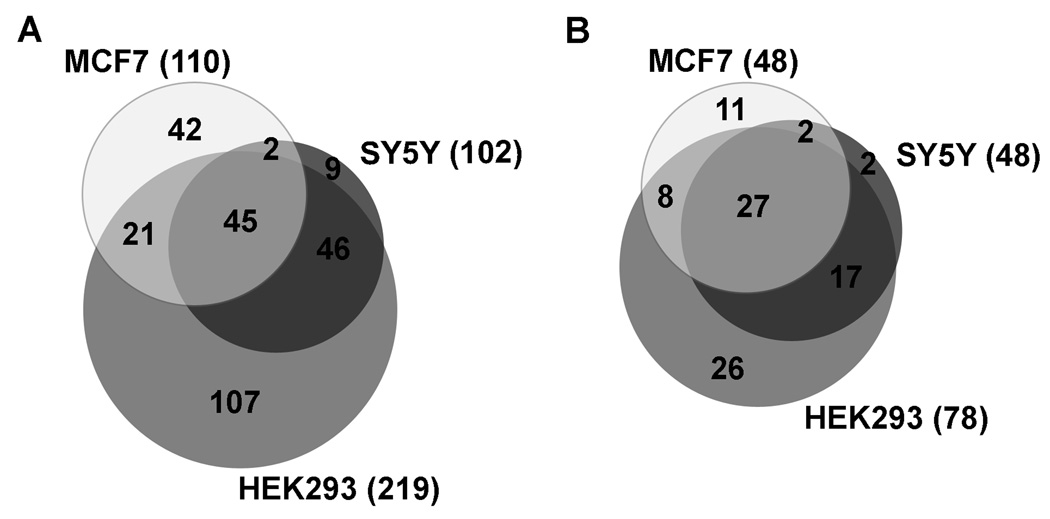
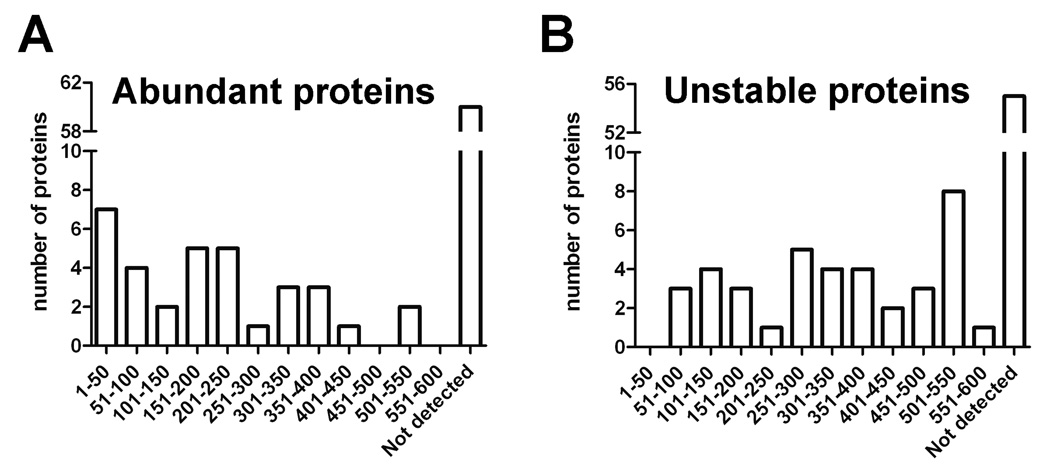
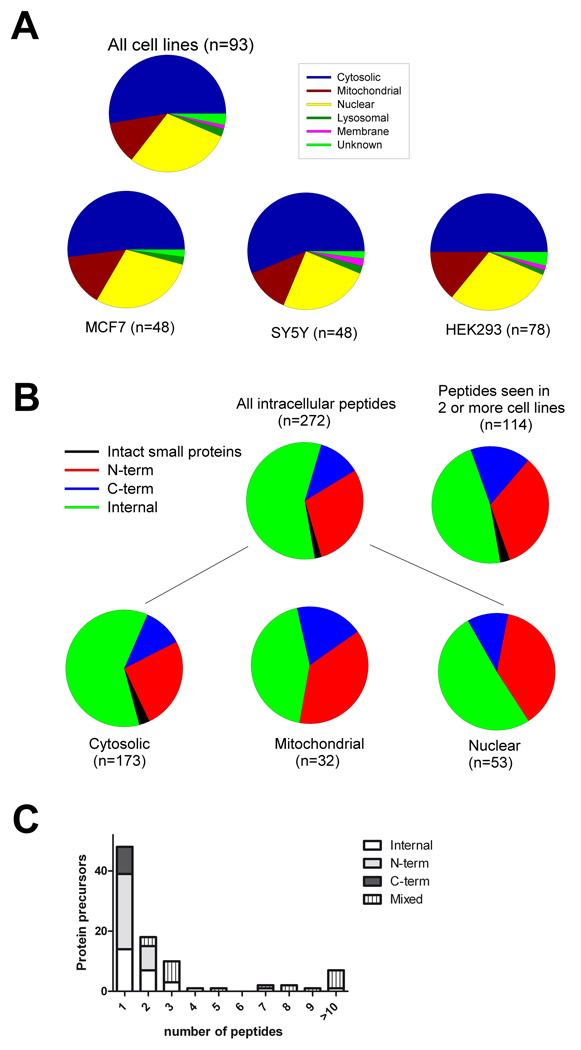
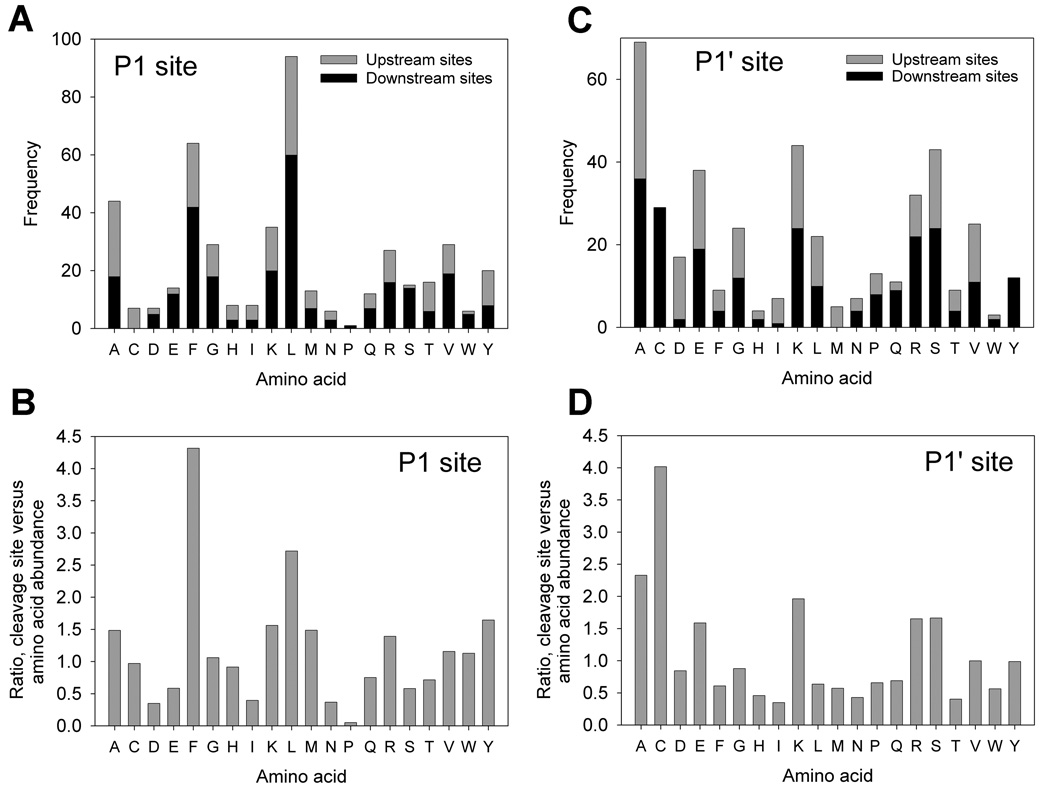
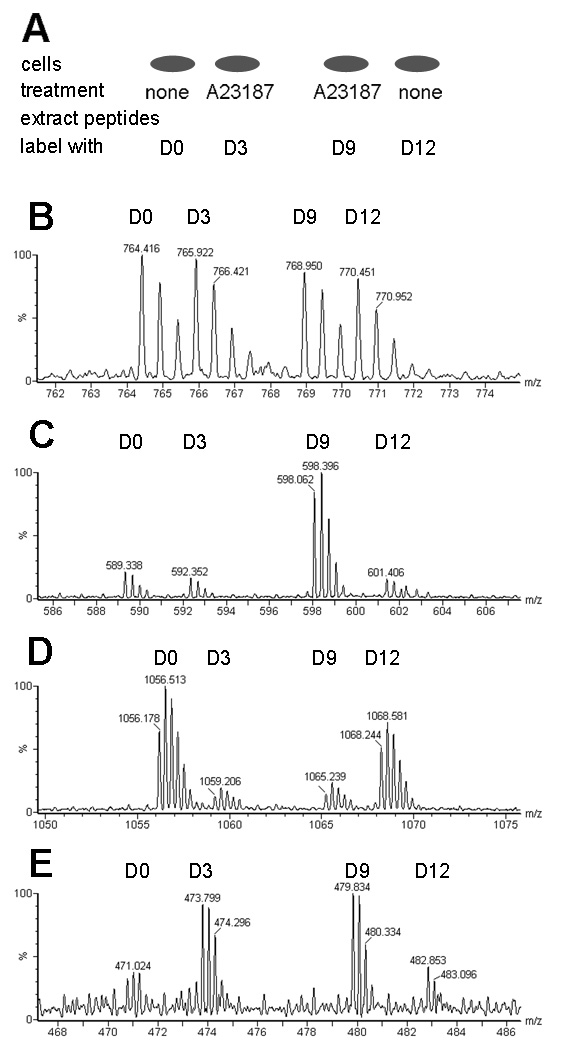
Peptides have been proposed to function in intracellular signaling within the cytosol. Although cytosolic peptides are considered to be highly unstable, a large number of peptides have been detected in mouse brain and other biological samples. In the present study, we evaluated the peptidome of three diverse cell lines: SH-SY5Y, MCF7, and HEK293 cells. A comparison of the peptidomes revealed considerable overlap in the identity of the peptides found in each cell line. The majority of the observed peptides are not derived from the most abundant or least stable proteins in the cell, and approximately half of the cellular peptides correspond to the N- or C- termini of the precursor proteins. Cleavage site analysis revealed a preference for hydrophobic residues in the P1 position. Quantitative peptidomic analysis indicated that the levels of most cellular peptides are not altered in response to elevated intracellular calcium, suggesting that calpain is not responsible for their production. The similarity of the peptidomes of the three cell lines and the lack of correlation with the predicted cellular degradome implies the selective formation or retention of these peptides, consistent with the hypothesis that they are functional in the cells.


Figures

Figure 1
Figure 1
Analysis of the overlap among the peptidome of SH-SY5Y, MCF7, and HEK293 cells. A: Comparison of the peptides found in each of the cell lines. For this analysis, peptides were considered present in multiple cell lines only if the identical peptide was present in the cell lines, and not merely a related peptide from the same protein precursor. The total number of peptides identified in each cell line are indicated in parentheses. B: Comparison of the precursor proteins of the identified peptides found in each cell line. For this analysis, protein precursors were considered to be present in multiple cell lines even if different peptides from the same precursor were identified in each of the cells. The total number of precursor proteins identified in each cell line are indicated in parentheses.
Figure 2
Figure 2
The majority of peptides found in the human cell lines do not come from the most abundant cellular proteins (A) or the least stable proteins (B). A: Protein precursors of cellular peptides identified in the present study in SH-SY5Y, MCF7, and HEK293 cells were compared to those previously reported by Schirle et al in HEK293 cells and other cell lines. The number of proteins found in both studies is plotted on the y-axis, with the results divided into groups based on the relative abundance values from Schirle et al, with 1–50 being the most abundant. Proteins identified in the present study but not detected in the previous proteomic studies are listed as “not detected.” B: Protein precursors of cellular peptides identified in the present study were compared to those previously reported by Doherty et al. in a study examining the degradation rates of HeLa cell proteins. Of the 93 precursor proteins found in the present study, 38 of these were included in the 573 proteins examined by Doherty et al. The number of proteins in both studies is plotted on the y-axis, with results divided into groups based on the stability; 1–50 represents the least stable group of proteins. Not detected indicates precursor proteins of peptides found in the present study that were not detected by Doherty et al.
Figure 3
Figure 3
Analysis of the intracellular location of the protein precursors identified in the present study, and the relative position of the peptide within the protein. A: The top panel shows the intracellular location of the protein precursors of peptides found in any of the three cell lines. The bottom panels illustrate the intracellular location of the proteins broken down by each individual cell line. B: The relative positions of the identified peptides within the precursor proteins are indicated. The top left pie graph shows the results for all peptides, and the top right graph shows the results only for peptides seen in at least two of the cell lines analyzed. The bottom graphs show the analysis for all peptides broken down by intracellular location of the precursor proteins. C: Analysis of the number of peptides identified from each protein precursor. The y-axis indicates the number of protein precursors and the x-axis indicates the number of peptides from each protein. These peptides were also classified by their location within the protein, either internal fragments, N- or C- termini, or a combination of the above (“mixed”).
Figure 4
Figure 4
Analysis of the cleavage site required to produce the peptides found in the three human cell lines. The cleavage site is defined as P1- P1’, with cleavage occurring between the two sites. Peptides located on the N-terminus of the protein require only a downstream cleavage (removal of the N-terminal initiator Met was not considered for the present analysis), and peptides located on the C-terminus of the protein require only an upstream cleavage. Internal peptides require both upstream and downstream cleavages. A: The number of peptides requiring cleavages is shown on the y-axis for each P1 amino acid. B: The P1 cleavage site analysis in panel A was adjusted to the relative abundance of each amino acid within human proteins, and plotted as a ratio such that 1.0 indicates the amino acid to be present in the cleavage sites at a level equal to the overall amino acid composition. Ratios above 1.0 indicate residues more frequently found in the cleavage site than elsewhere in the peptide. C: As in Panel A, except for the P1’ position. D: As in Panel B, except for the P1’ position.
Figure 5
Figure 5
Quantitative peptidomics approach to examine the effect of the calcium ionophore A23187 on levels of peptides in SH-SY5Y and MCF7 cells. A: Labeling scheme for experiments. Cells were either treated with A23187 in DPBS or incubated in DPBS without treatment (“none”). Peptides were extracted from each group and labeled with TMAB tags; the D0 and D12 tags were used with untreated cells and the D3 and D9 tags were used with A23187-treated cells. B: A representative spectrum showing a peptide from SH-SY5Y cells whose levels are not altered by the addition of A23187. The x-axis is mass/charge (m/z) and the y axis is relative abundance of peptide (%). This peptide was subsequently identified from M/S/MS analysis as Ac-MDTSRVQPIKLA (derived from 40S ribosomal protein S28) with 1 TMAB group (on the K) and 1 proton (on the R), for a charge state of 2+ (the TMAB group contributes a positive charge). C: An example of a peptide whose levels are variable among replicates. This unidentified peptide found in SH-SY5Y cells is present at the same relative abundance in the two untreated control groups and in one group of cells treated with A23187 whereas the other treated group has higher levels of this peptide. D: An example of a peptide that is decreased in response to treatment with A23187 in MCF7 cells. The peptide was subsequently identified by MS/MS as Ac-MEQVNELKEKGNKALSVGNIDDALQ (from stress-induced phosphoprotein 1), with 3 TMAB groups and no protons, for a charge of 3+. E: An example of an unidentified peptide that is increased in the groups that were treated with A23187 in MCF7 cells.

References

    1. Wysocki VH, Resing KA, Zhang Q, Cheng G. Methods. 2005;35:211–222. - PubMed
    1. Fricker LD, Lim J, Pan H, Che FY. Mass Spectrom Rev. 2006;25:327–344. - PubMed
    1. Svensson M, Skold K, Nilsson A, Falth M, Svenningsson P, Andren PE. Biochem Soc Trans. 2007;35:588–593. - PubMed
    1. Bora A, Annangudi SP, Millet LJ, Rubakhin SS, Forbes AJ, Kelleher NL, Gillette MU, Sweedler JV. J Proteome Res. 2008;7:4992–5003. - PMC - PubMed
    1. Cape SS, Dowell JA, Li L. Methods Mol Biol. 2009;492:381–393. - PubMed

Publication types