

SQID: an intensity-incorporated protein identification algorithm for tandem mass spectrometry
- PMID: 21204564
- PMCID: PMC3477243
- DOI: 10.1021/pr100959y
SQID: an intensity-incorporated protein identification algorithm for tandem mass spectrometry
Abstract
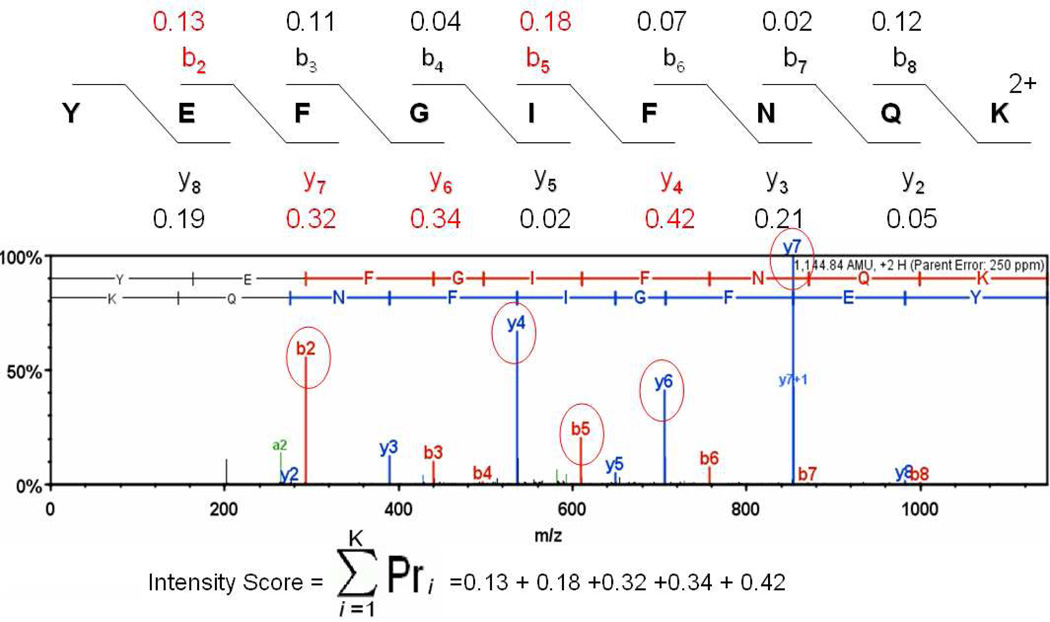
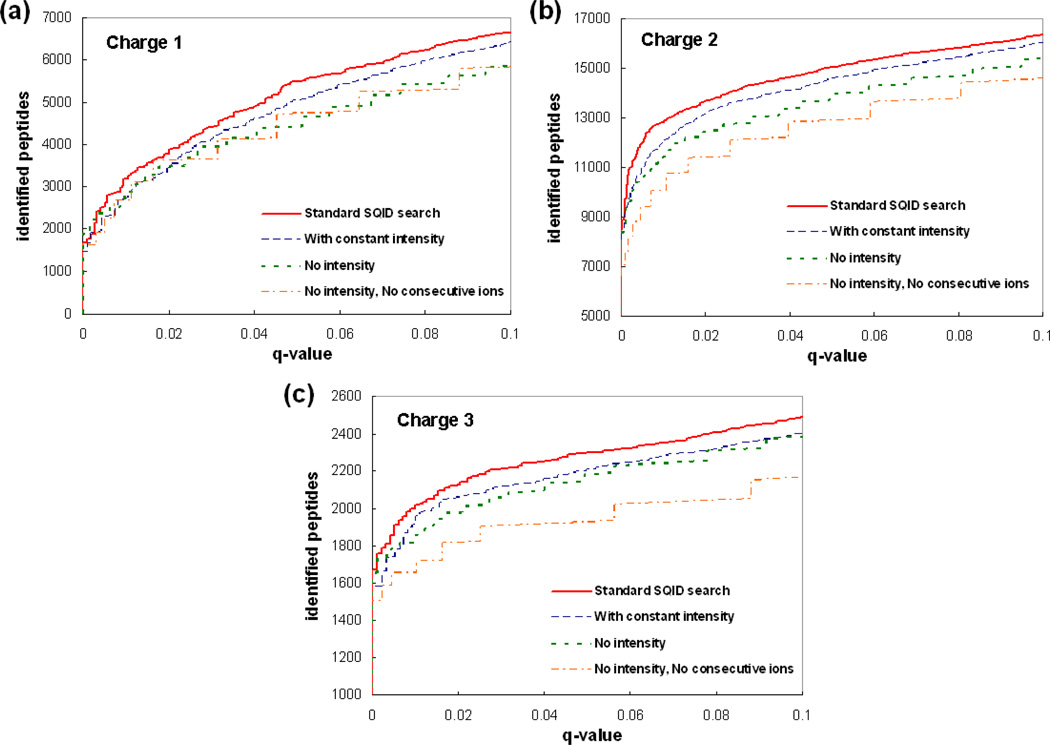
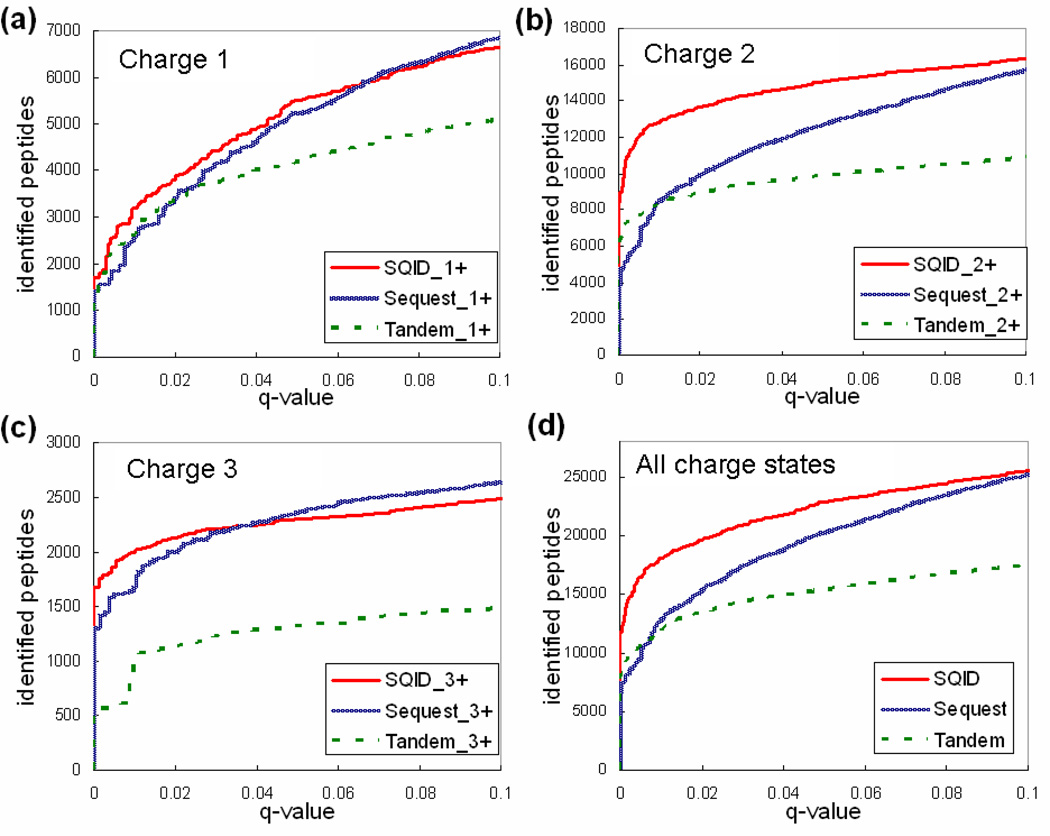
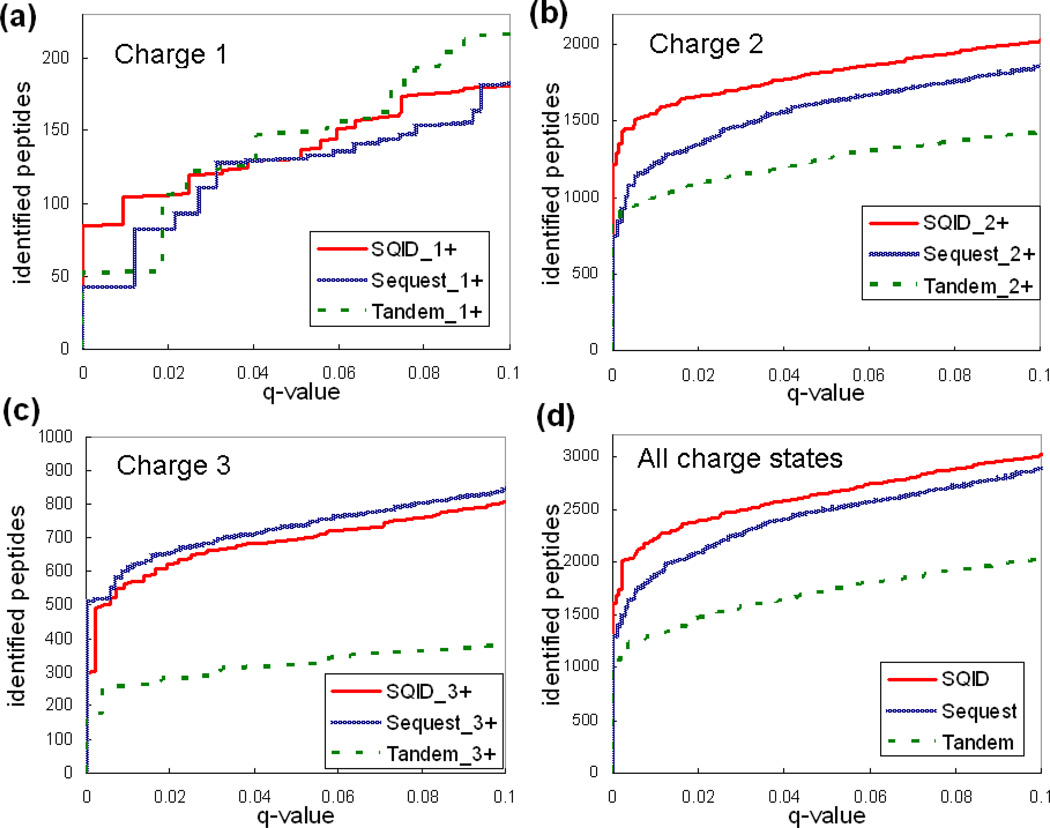
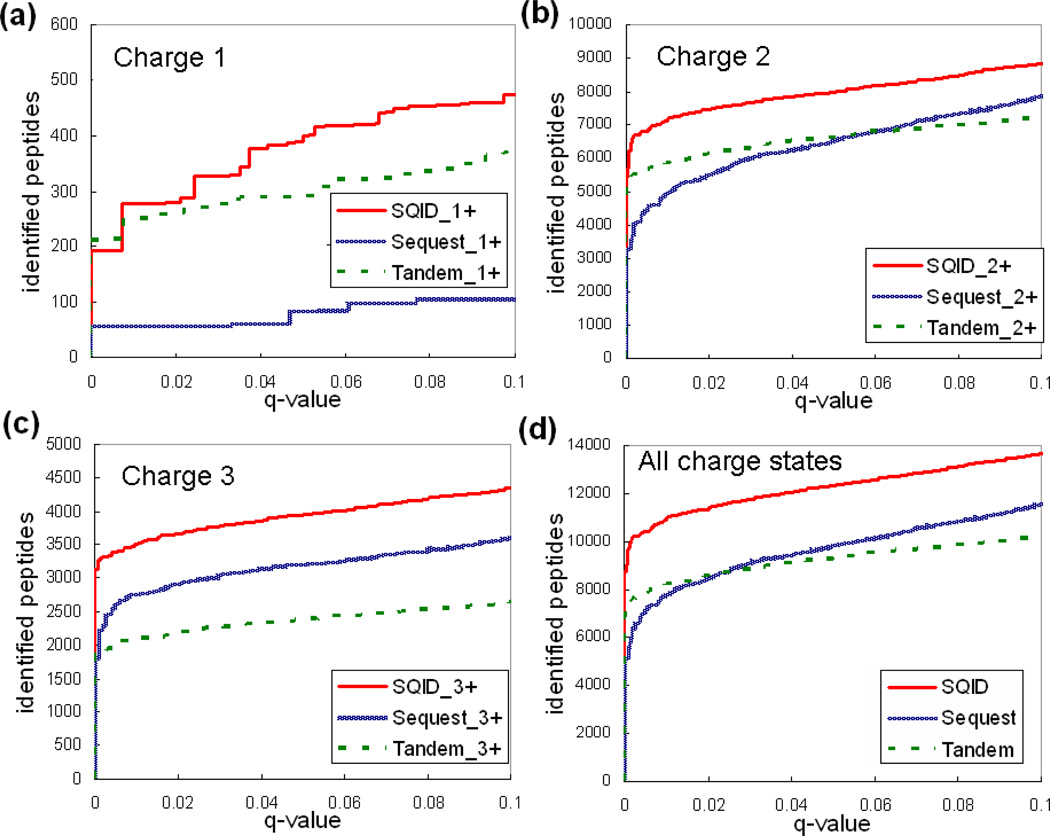
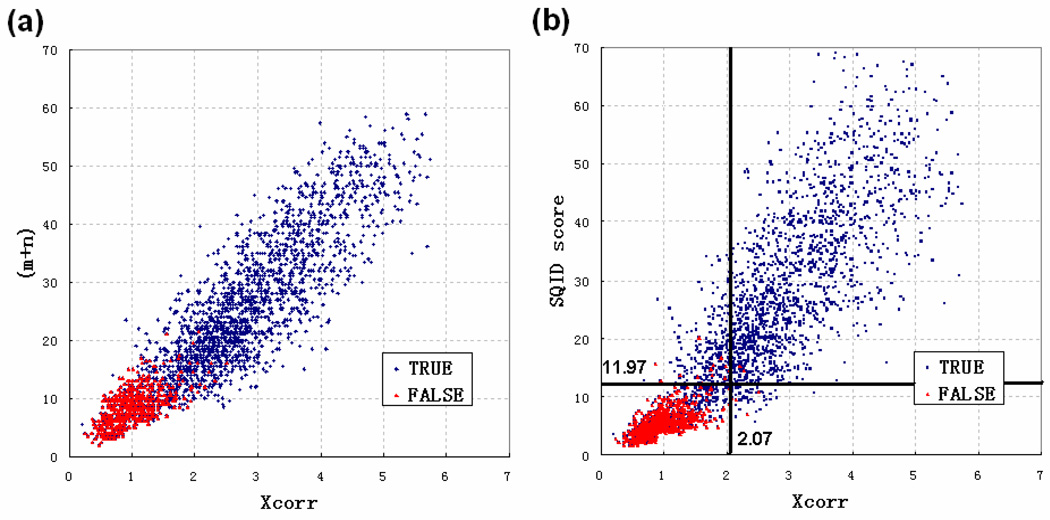
To interpret LC-MS/MS data in proteomics, most popular protein identification algorithms primarily use predicted fragment m/z values to assign peptide sequences to fragmentation spectra. The intensity information is often undervalued, because it is not as easy to predict and incorporate into algorithms. Nevertheless, the use of intensity to assist peptide identification is an attractive prospect and can potentially improve the confidence of matches and generate more identifications. On the basis of our previously reported study of fragmentation intensity patterns, we developed a protein identification algorithm, SeQuence IDentfication (SQID), that makes use of the coarse intensity from a statistical analysis. The scoring scheme was validated by comparing with Sequest and X!Tandem using three data sets, and the results indicate an improvement in the number of identified peptides, including unique peptides that are not identified by Sequest or X!Tandem. The software and source code are available under the GNU GPL license at http://quiz2.chem.arizona.edu/wysocki/bioinformatics.htm.
Figures
References
-
- Eng JK, McCormack AL, Yates JR. An approach to correlate tandem mass spectral data of peptides with amino acid sequences in a protein database. J Am Soc Mass Spectrom. 1994;5(11):976–989. - PubMed
-
- Craig R, Beavis RC. Tandem: matching proteins with mass spectra. Bioinformatics. 2004;20(9):1466–1467. - PubMed
-
- Perkins DN, Pappin DJ, Creasy DM, Cottrell JS. Probability-based protein identification by searching sequence databases using mass spectrometry data. Electrophoresis. 1999;20(18):3551–3567. - PubMed
-
- Sadygov RG, Cociorva D, Yates JR. Large-scale database searching using tandem mass spectra: looking up the answer in the back of the book. Nat. Methods. 2004;1(13):195–202. - PubMed
-
- Wysocki VH, Tsaprailis G, Smith LL, Breci LA. Mobile and localized protons: a framework for understanding peptide dissociation. Journal of Mass Spectrometry. 2000;35(12):1399–1406. - PubMed
Publication types
MeSH terms
Substances
Grants and funding
LinkOut - more resources
Full Text Sources
Molecular Biology Databases
