Comparative Study
. 2011 Jan;52(1):45-52.
doi: 10.1111/j.1528-1167.2010.02896.x. Epub 2011 Jan 4.

Further evidence that pathologic high-frequency oscillations are bursts of population spikes derived from recordings of identified cells in dentate gyrus

Affiliations
Comparative Study

Further evidence that pathologic high-frequency oscillations are bursts of population spikes derived from recordings of identified cells in dentate gyrus

Anatol Bragin et al. Epilepsia. 2011 Jan.

Abstract

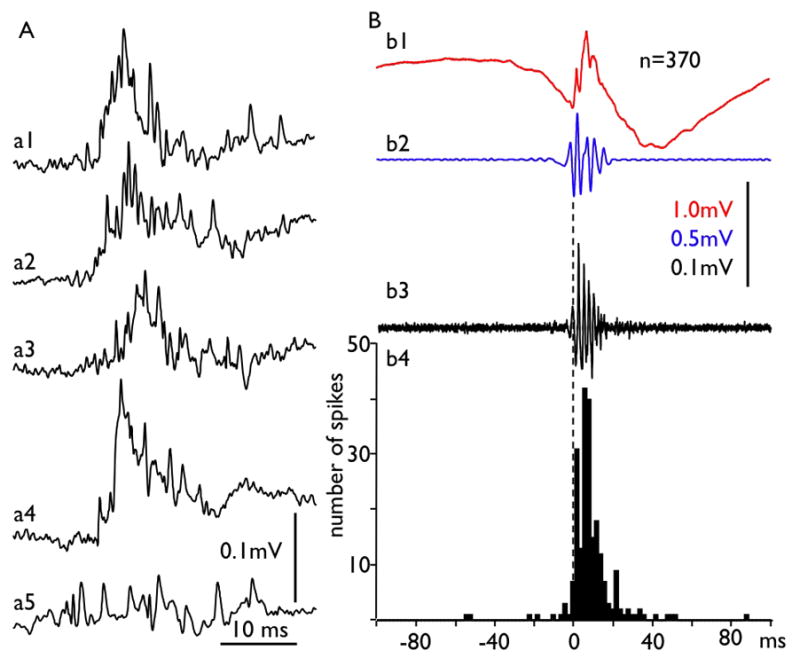
Purpose: To analyze activity of identified dentate gyrus granular cells and interneurons during pathologic high-frequency oscillations (pHFOs).

Methods: Pilocarpine-treated epileptic mice were anesthetized with urethane and ketamine. Their heads were fixed in a stereotaxic frame. Extracellular unit activity was recoded with glass micropipettes, whereas multiunit and local field activity was simultaneously recorded with attached tungsten microelectrodes. After electrophysiologic experiments, recorded cells were labeled by neurobiotin and visualized by immunohistochemical methods. KEY FINDINGS AND SIGNIFICANCES: pHFOs containing more than three waves were recorded in our experiments, but pathologic single-population spikes also occurred. Identified granular cells discharged preferentially in synchrony with pHFOs and single population spikes, whereas interneurons decreased their discharge frequency during this time. These experiments provide additional confirmation that pHFOs in the dentate gyrus represent single or recurrent population spikes, which in turn reflect summated hypersynchronous discharges of principal cells.


Conflict of interest statement

Disclosure: None of the authors has any conflict of interest related to this paper to disclose.

Figures

Fig. 1
Fig. 1
Examples of granular cells (a, b, c) and interneurons (d, e, f) labeled during electrophysiological experiments. Dashed lines indicate the border of the granular cell layer (g) and the hilus (h). Calibration marks are 50 μm
Fig. 2
Fig. 2
Discharges of an identified dentate gyrus granular cell during single population spikes and pathological high frequency oscillations (pHFOs). A – an example of two single population spikes (diamonds) and pHFOs (bracket) accompanied by discharges of the granular cell. A1 – raw data recorded with 0.1Hz – 5.0kHz frequency band. A2 – the same data filtered with frequency band 200–500Hz. A3 – discharges of the granular cell (labeled in B) recorded by the glass microelectrode with the tip located 200 μm from the tungsten microelectrode which recorded the field potentials in A1. A4 – color coded power spectrogram of the pHFO. Numbers on the color bar indicate energy in μV2. B – the granular cell labeled by neurobiotin after the completion of the electrophysiological experiments. Some dendritic branches are enhanced with Photoshop. C – an evoked field potential in response to perforant path stimulation. The beginning of a population EPSP indicated by the arrow is followed by two population spikes (diamonds). D. Perievent histogram of the granular cell discharges during 232 population spikes (red) where “0” is the beginning of the population spike.
Fig. 3
Fig. 3
Multiunit discharges and pHFOs. Examples of multiunit discharges from a single mouse are presented in part A (a1–a5) recorded with frequency band 0.1 to 5000 Hz to illustrate their “chaotic” nature. B. Average of 370 pHFOs (b1) recorded from the same experiment in wide band mode. The detection was performed at the first negative peak of the oscillation filtered with frequency band 100–500Hz (b2 and dashed line). b3 is the average of multiunit discharges. b4 – perievent histogram of mutiunit activity. The time bin for the histogram is 2 ms. Notice that in spite of the chaotic feature of the multiunit discharges (part A), on average both raw data records and high pass filtered multiunit discharges show rhytmicity in the pHFO frequency band. This figure confirms the hypothesis that pHFOs represent a field of hypersynchronized action potentials of multiple neuron discharges.
Fig. 4
Fig. 4
Suppression of discharges of an identified interneuron (Fig. 1d) during pHFOs. A. Perievent histogram of the interneuron triggered at the peak of the local field potentials (n=24, dashed line). B. Perievent histogram of simultaneously recorded multiunit activity that predominantly represents discharges of granular cells. C. Examples of an evoked potential in response to perforant path stimulation recorded for an interneuron by a glass microelectrode (top trace) and multiunit activity and local field potential by a tungsten microelectrode, located 500 μm apart within the granular layer. The shape of the evoked potential confirms, in addition to the histology, that both electrodes are located within the granular layer. D. Examples of discharges of an interneuron (int) and multiunit activity (mua) during a single pHFO. E. Color coded map of the local field potentials power in the frequency band 100Hz to 500 Hz.
Fig. 5
Fig. 5
Averaged discharges for 10 granular cells and 4 interneurons before, during (gray strip) and after a population spike recorded in the vicinity of the neurons. A and B represent perievent histograms of probabilities for granular cells and interneurons, where the zero point was the maximum amplitude of the population spike registered from the granular layer. Note that the peak reduction in the probability of interneuron firing (left dashed line) precedes the peak increase in probability of granular cell firing (right dashed line) by 2–3 msec.

References

    1. Bernard C, Wheal HV. A role for synaptic and network plasticity in controlling epileptiform activity in CA1 in the kainic acid-lesioned rat hippocampus in vitro. J Physiol (Lond) 1996;495:127–142. - PMC - PubMed
    1. Bragin A, Engel J, Jr, Wilson CL, Fried I, Mathern GW. Hippocampal and entorhinal cortex high-frequency oscillations (100–500 Hz) in human epileptic brain and in kainic acid-treated rats with chronic seizures. Epilepsia. 1999;40:127–137. - PubMed
    1. Bragin A, Jando G, Nadasdy Z, Hetke J, Wise K, Buzsaki G. Gamma (40–100 Hz) oscillation in the hippocampus of the behaving rat. J Neuroscie. 1995a;15:47–60. - PMC - PubMed
    1. Bragin A, Jando G, Nadasdy Z, van Landeghem M, Buzsaki G. Dentate EEG spikes and associated interneuronal population bursts in the hippocampal hilar region of the rat. J Neurophysiol. 1995b;73:1691–1705. - PubMed
    1. Bragin A, Mody I, Wilson CL, Engel J., Jr Local Generation of Fast Ripples in Epileptic Brain. J Neuroscience. 2002;22:2012–2021. - PMC - PubMed

Publication types