

Interpreting population pharmacokinetic-pharmacodynamic analyses - a clinical viewpoint
- PMID: 21204908
- PMCID: PMC3099367
- DOI: 10.1111/j.1365-2125.2010.03891.x
Interpreting population pharmacokinetic-pharmacodynamic analyses - a clinical viewpoint
Abstract
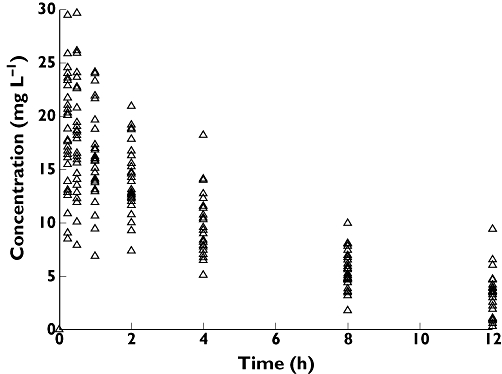
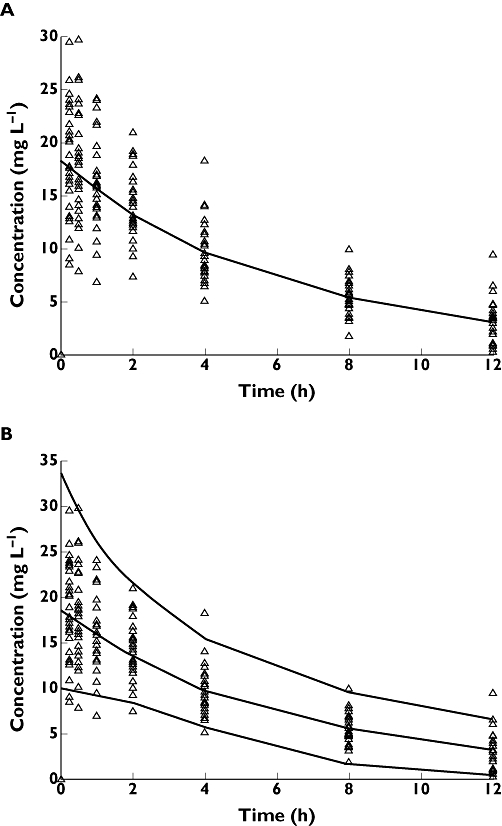
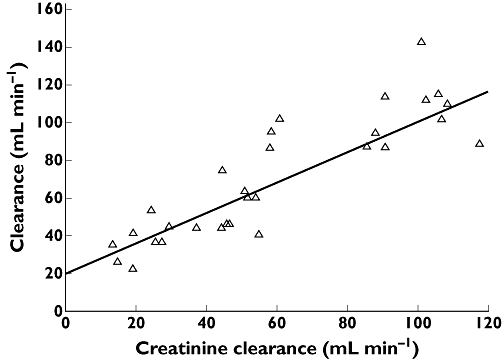
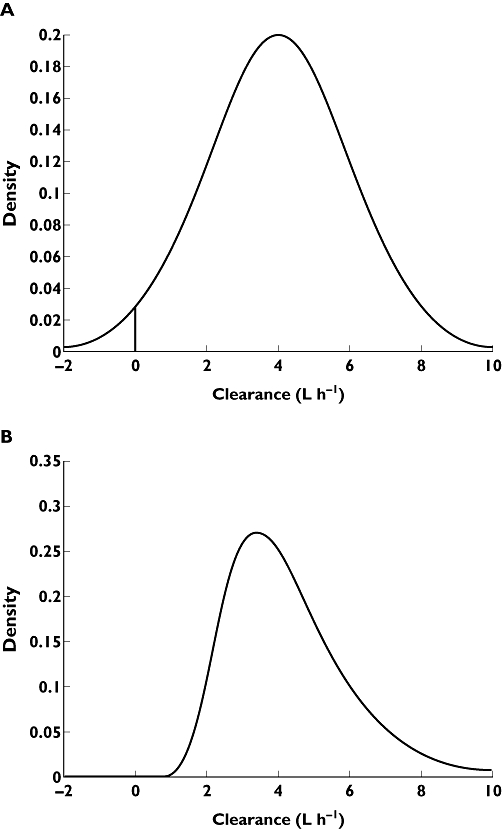
The population analysis approach is an important tool for clinical pharmacology in aiding the dose individualization of medicines. However, due to their statistical complexity the clinical utility of population analyses is often overlooked. One of the key reasons to conduct a population analysis is to investigate the potential benefits of individualization of drug dosing based on patient characteristics (termed covariate identification). The purpose of this review is to provide a tool to interpret and extract information from publications that describe population analysis. The target audience is those readers who are aware of population analyses but have not conducted the technical aspects of an analysis themselves. Initially we introduce the general framework of population analysis and work through a simple example with visual plots. We then follow-up with specific details on how to interpret population analyses for the purpose of identifying covariates and how to interpret their likely importance for dose individualization.
© 2011 The Authors. British Journal of Clinical Pharmacology © 2011 The British Pharmacological Society.
Figures
References
-
- Sheiner LB, Rosenberg B, Melmon KL. Modelling of individual pharmacokinetics for computer-aided drug dosage. Comput Biomed Res. 1972;5:411–59. - PubMed
-
- Sheiner LB, Rosenberg B, Marathe VV. Estimation of population characteristics of pharmacokinetic parameters from routine clinical data. J Pharmacokinet Biopharm. 1977;5:445–79. - PubMed
-
- Sheiner LB, Beal SL. Evaluation of methods for estimating population pharmacokinetic parameters II. Biexponential model and experimental pharmacokinetic data. J Pharmacokinet Biopharm. 1981;9:635–51. - PubMed
-
- Sheiner LB, Beal SL. Evaluation of methods for estimating population pharmacokinetic parameters. III. Monoexponential model: routine clinical pharmacokinetic data. J Pharmacokinet Biopharm. 1983;11:303–19. - PubMed
Publication types
MeSH terms
Substances
LinkOut - more resources
Full Text Sources
Medical
