. 2011 Mar;79(6):1445-61.
doi: 10.1111/j.1365-2958.2011.07534.x. Epub 2011 Jan 19.

YopK regulates the Yersinia pestis type III secretion system from within host cells

Affiliations

YopK regulates the Yersinia pestis type III secretion system from within host cells

Rebecca Dewoody et al. Mol Microbiol. 2011 Mar.

Abstract

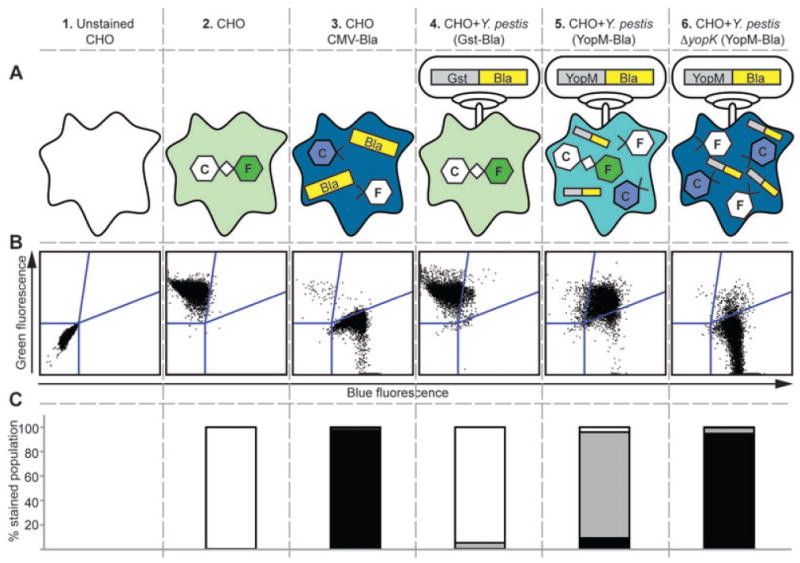
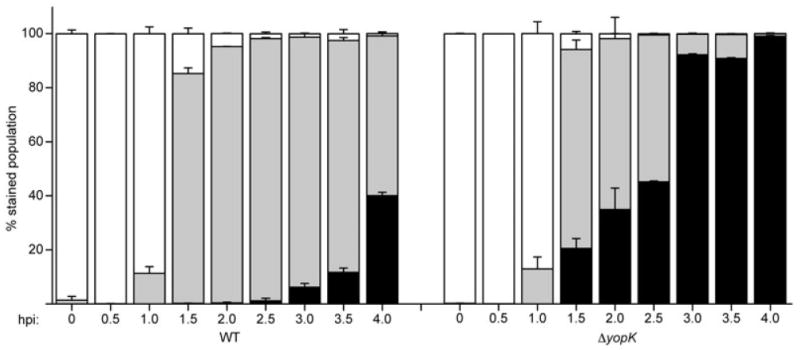
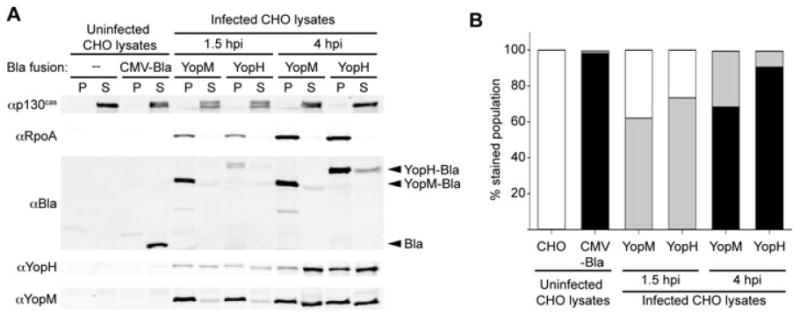
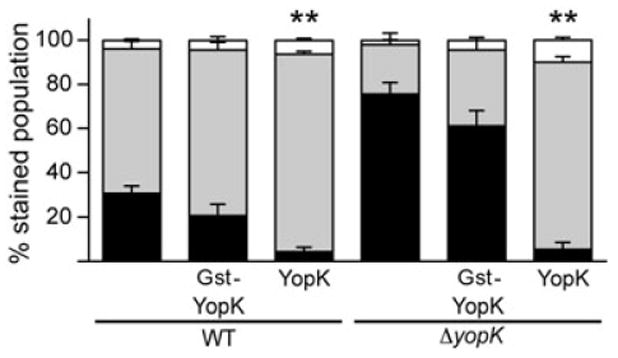
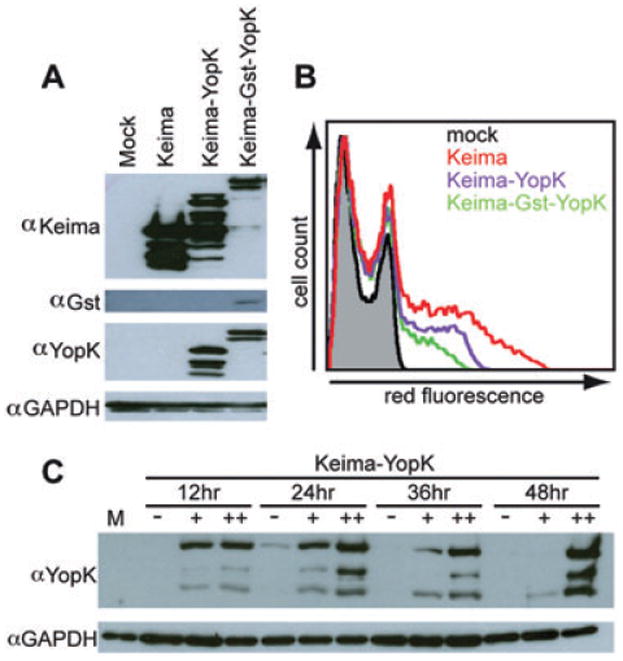
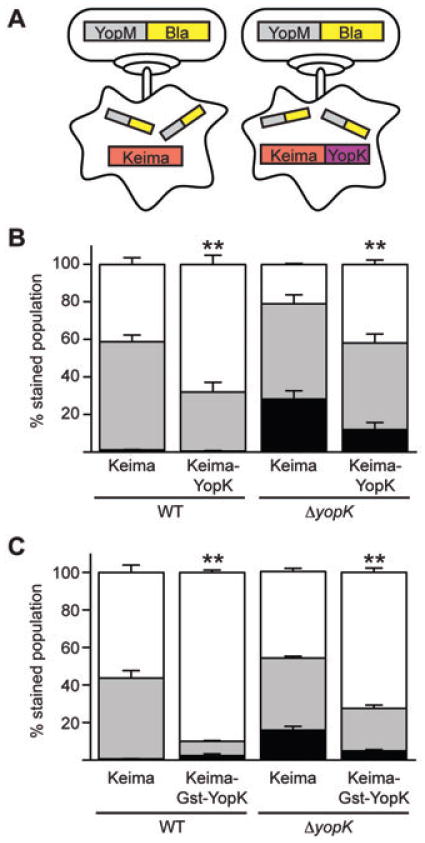
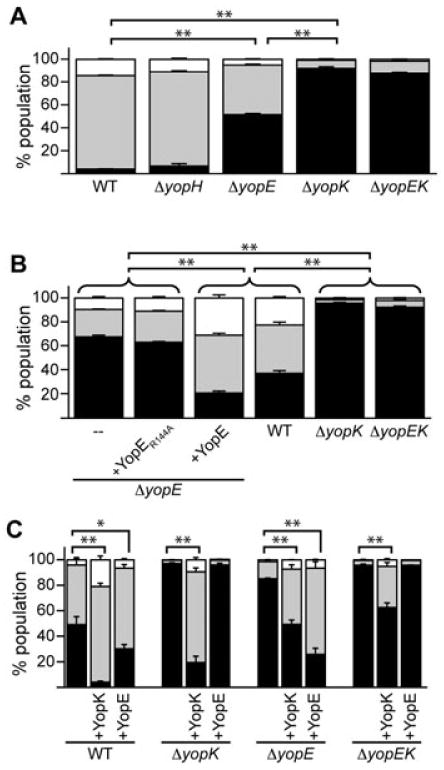
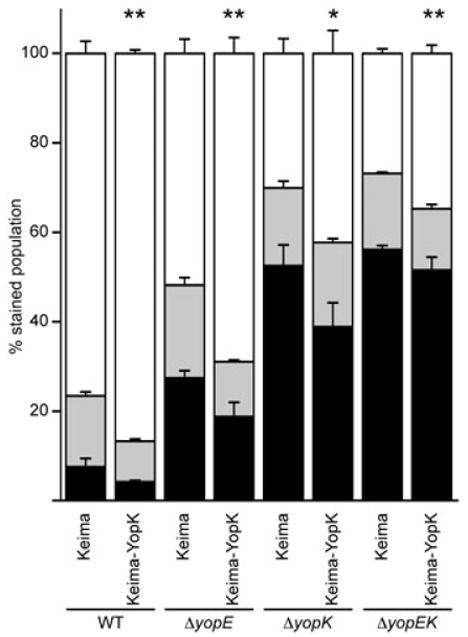
The pathogenic Yersinia species share a conserved type III secretion system, which delivers cytotoxic effectors known as Yops into target mammalian cells. In all three species, YopK (also called YopQ) plays an important role in regulating this process. In cell culture infections, yopK mutants inject higher levels of Yops, leading to increase cytotoxicity; however, in vivo the same mutants are highly attenuated. In this work, we investigate the mechanism behind this paradox. Using a β-lactamase reporter assay to directly measure the effect of YopK on translocation, we demonstrated that YopK controls the rate of Yop injection. Furthermore, we find that YopK cannot regulate effector Yop translocation from within the bacterial cytosol. YopE is also injected into host cells and was previously shown to contribute to regulation of the injectisome. In this work we show that YopK and YopE work at different steps to regulate Yop injection, with YopK functioning independently of YopE. Finally, by expressing YopK within tissue culture cells, we confirm that YopK regulates translocation from inside the host cell, and we show that cells pre-loaded with YopK are resistant to Yop injection. These results suggest a novel role for YopK in controlling the Yersinia type III secretion system.


Figures

Fig. 1
Fig. 1
Schematic of quantitative Bla reporter assay. (A) shows the nature of the cell populations being analysed. (B) displays raw flow cytometry data. In (C), the flow cytometry data are quantified in stacked bar graph format. Columns 1–3 show uninfected samples used to establish both compensation settings and gates for flow cytometry. Unstained CHO cells determine the population negative for fluorescence. The rest of the samples have been incubated with CCF2-AM, a compound fluorophore composed of Coumarin (C) and Fluorescein (F) groups connected via a β-lactam ring. A CHO cell line that constitutively expresses Bla (CHO CMV-Bla) is used to create a gate for cells with only blue fluorescence (column 3). The gate between green and blue (upper right quadrant) is for cells with low-level injection that have incomplete cleavage of CCF2-AM and exhibit both blue and green fluorescence, referred to as aqua. Columns 4–6 show CHO cells infected with WT or ΔyopK Y. pestis expressing the Gst-Bla control or the YopM-Bla reporter. The flow cytometry data are shown in stacked bar graph format as % stained population, referring to the percentage of cells within the population of stained cells that exhibit either green (white bars), aqua (grey bars) or blue (black bars) fluorescence.
Fig. 2
Fig. 2
YopK controls the rate of translocation. WT and ΔyopK Y. pestis carrying YopM-Bla were used to infect CHO cells at an moi = 10. At the indicated times post infection, cells were stained with CCF2-AM and analysed by flow cytometry. Each infection was carried out in triplicate and samples were averaged with standard deviation error bars. White bars: green cells (uninjected), grey bars: aqua cells (low-level injection), black bars: blue cells (high-level injection).
Fig. 3
Fig. 3
Accumulation of Yops within host cells. WT Y. pestis carrying either YopM-Bla or YopH-Bla were used to infect CHO cells at an moi = 10. At 1.5 and 4 h post infection (hpi), a portion of the cells were stained with CCF2-AM and analysed by flow cytometry (B). The remaining cells were permeabilized with digitonin to separate soluble cytoplasmic proteins including injected Yops (supernatant fraction, S) from membranes, organelles and adherent bacteria (pellet fraction, P). The proteins in each fraction were visualized by immunoblotting (A). p130cas (cytoplasmic eukaryotic protein) and RpoA (cytoplasmic bacterial protein) serve as fractionation controls. Because the data in (B) are from the same individual infections shown in (A), error bars are not available.
Fig. 4
Fig. 4
Gst–YopK does not complement ΔyopK. Plasmids expressing Gst–YopK or YopK were transformed into WT and ΔyopK Y. pestis carrying YopM-Bla. These strains were used to infect CHO cells at an moi = 10 for ∼3 h, followed by CCF2-AM staining and flow cytometry. Each infection is carried out in triplicate and samples are averaged with standard deviation error bars. Student's t-test was performed to demonstrate significant differences in high-level injection (blue cells) relative to empty parent strains (**P < 0.001).
Fig. 5
Fig. 5
Characterization of eukaryotic YopK expression vectors. A. CHO cells transfected for 24 h were lysed, subjected to SDS-PAGE and Western blotted with antibody raised against YopK, Keima, Gst and p130cas as a loading control. B. Twenty-four-hour transfected CHO cells were suspended and analysed via flow cytometry for red fluorescence. The histogram shows the traces of a negative mock-transfected population (black), cells carrying the empty vector expressing Keima (red), cells expressing Keima–YopK (purple) and cells expressing Keima–Gst–YopK (green). C. CHO cells transfected for times ranging from 12 to 48 h were divided into populations with no (−), low (+) or high (++) red fluorescence using FACS. Each sample was lysed, subjected to SDS-PAGE and Western blotted to visualize YopK and loading control GAPDH.
Fig. 6
Fig. 6
Keima–YopK negatively regulates effector Yop translocation. A. Schematic of transfection of CHO cells with plasmids expressing Keima or Keima–YopK followed by infection with Y. pestis and injection of the YopM-Bla reporter. B and C. CHO cells expressing either Keima, Keima–YopK or Keima–Gst–YopK were infected with WT or ΔyopK Y. pestis carrying the YopM-Bla reporter. The CHO cells were then stained with CCF2-AM and analysed by flow cytometry for red, green and blue fluorescence. Infections were performed in triplicate and are shown as averages with standard deviations. Student's t-test was performed to demonstrate significant differences in total injection levels (aqua + blue cells) for strains expressing Keima–YopK or Keima–Gst–YopK relative to the Keima-only controls (**P < 0.001). The data shown are representative of one data set, and the experiment was performed at least twice.
Fig. 7
Fig. 7
Regulation of translocation by YopK and YopE. A. CHO cells were infected with WT or mutant Y. pestis strains carrying the YopM-Bla reporter at moi = 10 for ∼3 h. Cells were stained with CCF2-AM and injection was quantified by flow cytometry. Infections were performed in triplicate and the entire experiment was repeated at least twice. The data shown are a representative data set from one experiment showing average injection levels and standard deviation error bars. High-level injection (blue cells) was compared using one-way ANOVA with Tukey post hoc test. B. ΔyopE Y. pestis strains were complemented with plasmids expressing either YopE or a GAP-deficient YopE (YopER144A), used to infect CHO cells, and injection of the YopM-Bla reporter was measured. Assays and analysis were performed as in (A). C. Y. pestis strains were transformed with plasmids expressing YopK or YopE in addition to the YopM-Bla reporter and used to infect CHO cells as in (A). Student's t-test was performed to demonstrate significant differences in high-level injection relative to empty parent strains. For all panels, *P < 0.01, **P < 0.001.
Fig. 8
Fig. 8
YopK regulation of TTSS is independent of YopE. CHO cells were transfected with plasmids expressing Keima or Keima–YopK and then infected with Y. pestis strains carrying the YopM-Bla reporter as done in Fig. 6. Infections were performed in triplicate and are shown as average with standard deviation. Student's t-test was performed to demonstrate significant differences in total injection levels (aqua + blue cells) for strains expressing Keima–YopK relative to the Keima-only controls (**P < 0.005, *P < 0.05). The data shown are representative of one data set and the experiment was performed at least twice.

References

    1. Aili M, Hallberg B, Wolf-Watz H, Rosqvist R. GAP activity of Yersinia YopE. Methods Enzymol. 2002;358:359–370. - PubMed
    1. Aili M, Isaksson EL, Carlsson SE, Wolf-Watz H, Rosqvist R, Francis MS. Regulation of Yersinia Yop-effector delivery by translocated YopE. Int J Med Microbiol. 2008;298:183–192. - PubMed
    1. Ben-Gurion R, Shafferman A. Essential virulence determinants of different Yersinia species are carried on a common plasmid. Plasmid. 1981;5:183–187. - PubMed
    1. Black DS, Bliska JB. The RhoGAP activity of the Yersinia pseudotuberculosis cytotoxin YopE is required for antiphagocytic function and virulence. Mol Microbiol. 2000;37:515–527. - PubMed
    1. Boland A, Havaux S, Cornelis GR. Heterogeneity of the Yersinia YopM protein. Microb Pathog. 1998;25:343–348. - PubMed

Publication types

Substances