. 2011 Feb;155(2):916-31.
doi: 10.1104/pp.110.168641. Epub 2010 Dec 27.

Coordinated activation of cellulose and repression of lignin biosynthesis pathways in rice

Affiliations

Coordinated activation of cellulose and repression of lignin biosynthesis pathways in rice

Madana M R Ambavaram et al. Plant Physiol. 2011 Feb.

Abstract

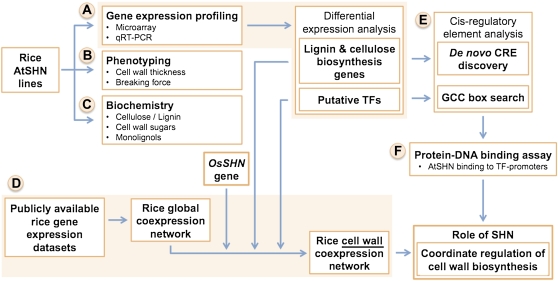
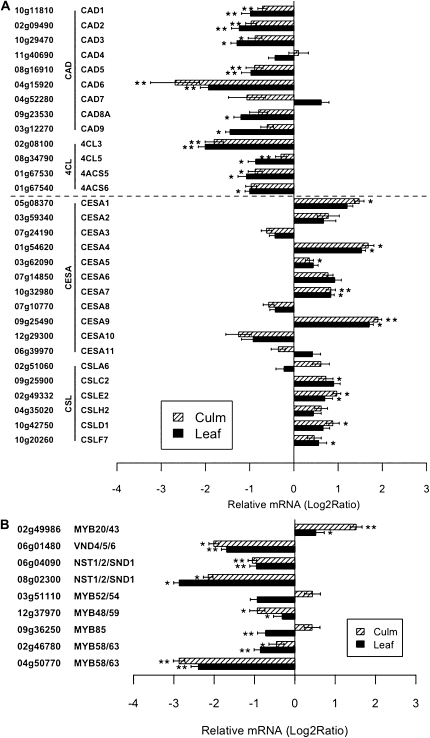
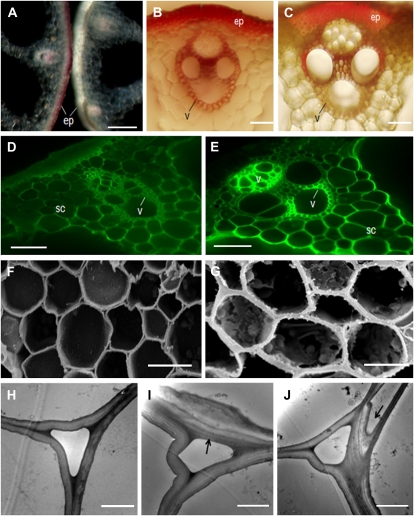
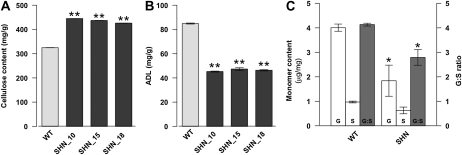
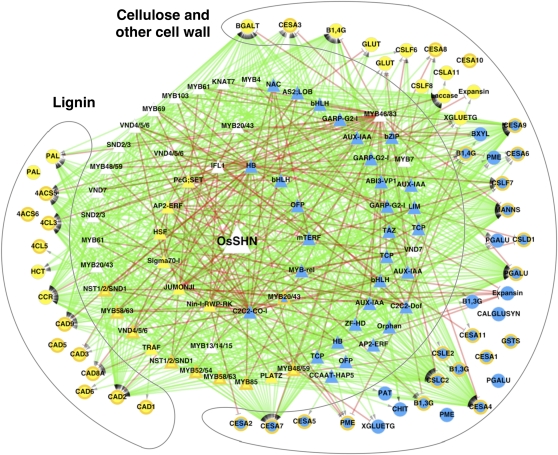
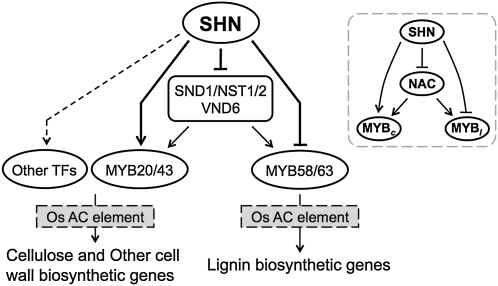
Cellulose from plant biomass is the largest renewable energy resource of carbon fixed from the atmosphere, which can be converted into fermentable sugars for production into ethanol. However, the cellulose present as lignocellulosic biomass is embedded in a hemicellulose and lignin matrix from which it needs to be extracted for efficient processing. Here, we show that expression of an Arabidopsis (Arabidopsis thaliana) transcription factor, SHINE (SHN), in rice (Oryza sativa), a model for the grasses, causes a 34% increase in cellulose and a 45% reduction in lignin content. The rice AtSHN lines also exhibit an altered lignin composition correlated with improved digestibility, with no compromise in plant strength and performance. Using a detailed systems-level analysis of global gene expression in rice, we reveal the SHN regulatory network coordinating down-regulation of lignin biosynthesis and up-regulation of cellulose and other cell wall biosynthesis pathway genes. The results thus support the development of nonfood crops and crop wastes with increased cellulose and low lignin with good agronomic performance that could improve the economic viability of lignocellulosic crop utilization for biofuels.


Figures

Figure 1.
Figure 1.
Integrated systems analysis workflow for elucidation of the role of SHN in the regulation of cell wall biosynthesis in rice. A, Gene expression profiling of rice AtSHN lines was used to characterize differentially expressed genes (compared with the wild type). B and C, Phenotyping and biochemical analysis were used to discern the status of cell wall biosynthesis in rice AtSHN lines. D, Coexpression analysis was used to establish the transcriptional network of cell wall-related genes, identify the relevance of the rice SHN (OsSHN) gene to this network, and independently validate the gene expression profile (from A). E, Cis-regulatory element analysis was used to predict potential promoter regions that could be involved in gene regulation by SHN and other putative cell wall TFs. F, Protein-DNA binding assay was used to evaluate AtSHN interaction with promoter regions of predicted target genes. Our observations from this integrative computational and experimental approach were used to reveal the role of SHN as a key regulator of cell wall biosynthesis in rice. [See online article for color version of this figure.]
Figure 2.
Figure 2.
Expression analysis of cell wall biosynthetic genes and their putative transcriptional regulators assessed through qRT-PCR. A, Relative expression of lignin and cellulose biosynthesis genes in SHN leaf and culm compared with that in the wild type. B, Relative expression of putative cell wall TF genes in SHN leaf and culm compared with that in the wild type. Data are expressed as mean relative transcript levels in SHN lines compared with the wild type (log2 ratio) in each tissue type (leaf and culm). Error bars represent se (n = 3; three wild-type and three SHN lines). Asterisks indicate levels of significance of differential expression (t test; * P ≤ 0.05, ** P ≤ 0.01).
Figure 3.
Figure 3.
Phenotypic characterization of rice AtSHN lines. A to C, Phloroglucinol staining for lignin in culm (stem) sections of rice AtSHN (right) and wild-type (left) lines; sections were visualized by light microscopy (A, 5× magnification; B and C, 20× magnification). Lignin in epidermal (ep) and vascular (v) tissue is significantly reduced in SHN lines. D and E, Calcofluor staining of wild-type (D) and SHN (E) culm sections, showing increased cellulose in cell walls of sclerenchyma (sc) and vascular bundles (v) in SHN lines. F and G, Scanning electron micrographs of transverse sections of wild-type (F) and SHN (G) culms. H to J, Transmission electron micrographs of wild-type (H) and SHN (I and J) parenchyma cell walls. Arrows show the thickened and folded walls. Bars = 200 μm in A, 40 μm in B and C, 50 μm in D and E, 10 μm in F and G, and 4 μm in H to J.
Figure 4.
Figure 4.
Cell wall composition analysis of rice AtSHN culms. A, Cellulose content measured in rice AtSHN lines and the wild type (WT). B, Lignin content estimated as the percentage of acid detergent lignin in terms of dry matter. C, Lignin monomer ratio G:S assayed by GC-MS analysis of rice AtSHN lines and the wild type. Data represent means ± se (n = 6 for each genotype in A, n = 3 [each replicate being a pool of two plants] for each genotype in B, and n = 3 [with replicates corresponding to independent wild-type or SHN lines] in C). Asterisks indicate levels of significance compared with the wild type (t test; * P ≤ 0.05, ** P ≤ 0.01).
Figure 5.
Figure 5.
Coexpression network analysis and model of cell wall synthesis in rice. The coexpression network connects TFs (triangles) to pathway gene targets (circles) through directed edges and TFs to each other through undirected edges. Positive and negative correlation edges are colored green and red, respectively. Nodes are labeled with the gene name/family and colored based on the direction of regulation in response to SHN expression (microarray data supplemented by qRT-PCR) with blue, yellow, and white for up-regulation, down-regulation, and no regulation, respectively. Genes tested for differential expression using qRT-PCR are denoted with thick orange borders. The outer rings of TFs are all positively coexpressed with each other; hence, all the green edges connecting them to each other have been removed for clarity. See Supplemental Table S1 for identifiers, names, and annotations of all the genes in the network. This network is provided in Supplemental File S1 and can be imported into Cytoscape.
Figure 6.
Figure 6.
Gel retardation assay of AtSHN binding to the promoter sequence of putative secondary cell wall TF genes. A, Locations of the GCC box motif ([AG]CCGNC) in the 1-kb upstream sequences of the SHN-regulated TF genes. Upright and inverted triangles represent + and – strands, respectively. Dark triangles signify the presence of the GCC core (GCCGCC). Small circles above or below a triangle represent another overlapping GCC box motif in the + or – strand, respectively. B, The locations of DNA fragments used for electrophoretic mobility shift assay are selected based on the abundance of GCC box motifs shown in A. Each of the end-labeled domains was competed with 100-fold excess of the competing unlabeled domain, whereas ++ was 60-fold. + and − indicate the presence and absence of the respective component in the binding reaction. The labeled “free probe” and DNA-protein complex “bound probe” positions are indicated, showing competition with an unlabeled fragment for each promoter domain.
Figure 7.
Figure 7.
Hypothetical model of transcriptional regulation of cell wall biosynthesis in rice. Dashed arrows are hypothesized interactions based on the coexpression network and gene expression changes. Thick arrows emanating from SHN represent the confirmed interaction of SHN to the upstream regions of the TFs. In the inset, NAC represents the NAC main switches and MYBc and MYBl represent downstream MYB TFs hypothesized to be specific to cellulose/other cell wall genes and lignin genes, respectively.

References

    1. Adkins NL, Hagerman TA, Georgel P. (2006) GAGA protein: a multi-faceted transcription factor. Biochem Cell Biol 84: 559–567 - PubMed
    1. Aharoni A, Dixit S, Jetter R, Thoenes E, van Arkel G, Pereira A. (2004) The SHINE clade of AP2 domain transcription factors activates wax biosynthesis, alters cuticle properties, and confers drought tolerance when overexpressed in Arabidopsis. Plant Cell 16: 2463–2480 - PMC - PubMed
    1. Albersheim P, Nevins DJ, English PD, Karr A. (1967) A method for the analysis of sugars in plant cell-wall polysaccharides by gas-liquid chromatography. Carbohydr Res 5: 340–345
    1. Altschul SF, Gish W, Miller W, Myers EW, Lipman DJ. (1990) Basic local alignment search tool. J Mol Biol 215: 403–410 - PubMed
    1. Ambavaram MM, Pereira A. (2010) Setting up reverse transcription quantitative-PCR experiments. Methods Mol Biol 678: 45–54 - PubMed

Publication types