. 2011 Jan;21(1):33-46.
doi: 10.1101/gr.111609.110.

Observation and prediction of recurrent human translocations mediated by NAHR between nonhomologous chromosomes

Affiliations

Observation and prediction of recurrent human translocations mediated by NAHR between nonhomologous chromosomes

Zhishuo Ou et al. Genome Res. 2011 Jan.

Abstract

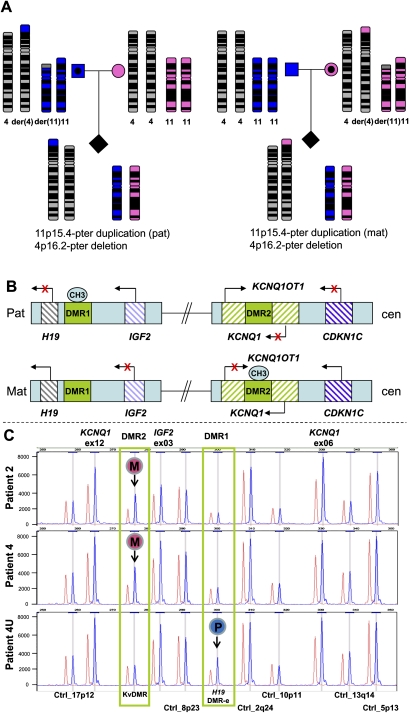
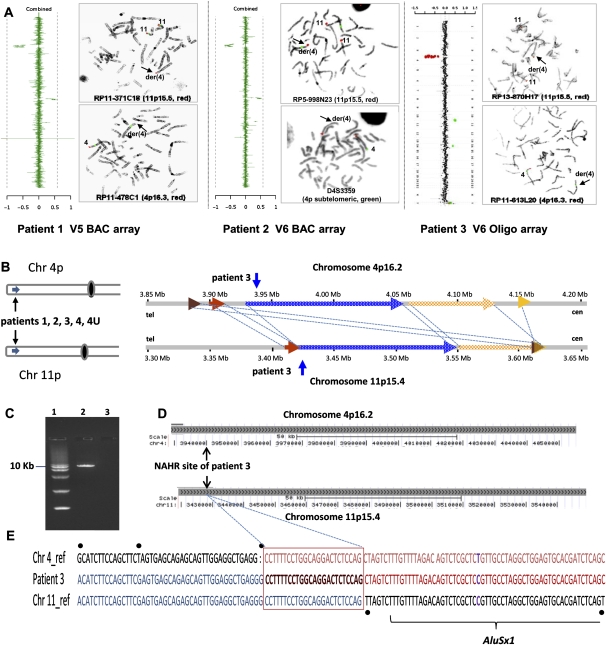
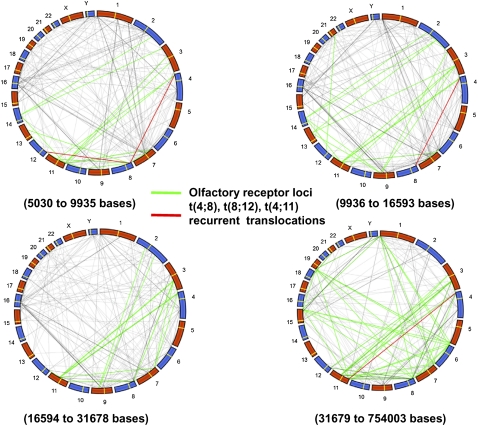
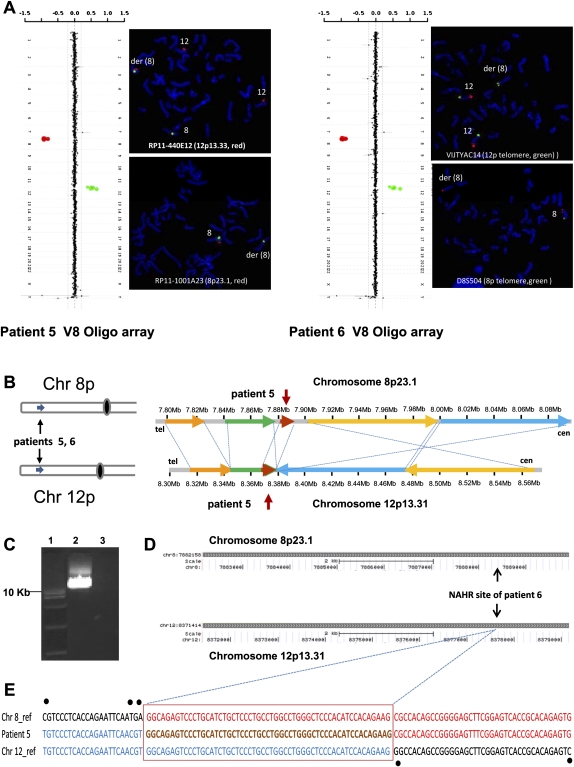
Four unrelated families with the same unbalanced translocation der(4)t(4;11)(p16.2;p15.4) were analyzed. Both of the breakpoint regions in 4p16.2 and 11p15.4 were narrowed to large ∼359-kb and ∼215-kb low-copy repeat (LCR) clusters, respectively, by aCGH and SNP array analyses. DNA sequencing enabled mapping the breakpoints of one translocation to 24 bp within interchromosomal paralogous LCRs of ∼130 kb in length and 94.7% DNA sequence identity located in olfactory receptor gene clusters, indicating nonallelic homologous recombination (NAHR) as the mechanism for translocation formation. To investigate the potential involvement of interchromosomal LCRs in recurrent chromosomal translocation formation, we performed computational genome-wide analyses and identified 1143 interchromosomal LCR substrate pairs, >5 kb in size and sharing >94% sequence identity that can potentially mediate chromosomal translocations. Additional evidence for interchromosomal NAHR mediated translocation formation was provided by sequencing the breakpoints of another recurrent translocation, der(8)t(8;12)(p23.1;p13.31). The NAHR sites were mapped within 55 bp in ∼7.8-kb paralogous subunits of 95.3% sequence identity located in the ∼579-kb (chr 8) and ∼287-kb (chr 12) LCR clusters. We demonstrate that NAHR mediates recurrent constitutional translocations t(4;11) and t(8;12) and potentially many other interchromosomal translocations throughout the human genome. Furthermore, we provide a computationally determined genome-wide "recurrent translocation map."


Figures

Figure 1.
Figure 1.
Methylation pattern and copy number analysis by MS-MLPA of patients with recurrent t(4;11). (A) Pedigrees illustrating the parental origin of the duplicated 11p material if the balanced translocation is present in the father (left), or the mother (right). (Blue) Paternal inheritance; (pink) maternal inheritance. (B) Schematic representation of the imprinted region at 11p15. The imprinted 11p15 region consists of two independent domains that are regulated by differentially methylated regions (DMR). The telomeric DMR1 is paternally methylated and regulates reciprocal expression of H19 and IGF2 genes. The centromeric DMR2 is maternally methylated and regulates expression of imprinted genes in this region including CDKN1C, KCNQ1OT1, and KCNQ1. CH3 represents the methylated allele. (C) Partial profile of MS-MLPA HhaI digestion/ligation products for patients 2, 4, and 4U (blue) compared to normal control (red). Increased peak intensities of IGF2 and KCNQ1 in patients 2, 4, and 4U indicate duplication of the 11p15 region. Gain of methylation in the HhaI sensitive DMR2 was detected in patients 2 and 4, whereas gain of methylation in the HhaI sensitive DMR1 was detected in patient 4U. The results demonstrated that maternal inheritance (M) of the duplicated 11p15 region in patients 2 and 4 and paternal inheritance (P) of the duplicated 11p15 region in patient 4U.
Figure 2.
Figure 2.
Identification of the LCR pairs acting as potential substrates for interchromosomal NAHR, resulting in the t(4;11) formation. (A) CMA profile of DNA from patient 1 (left). The mean normalized log2 (Cy3/Cy5) ratio of each BAC clone is plotted on the x-axis as dots with error bars, and arranged along the vertical axis from chromosome 1 at the top to chromosomes X and Y at the bottom. All 11 clones on the 4p subtelomeric region showed displacement to the left, indicating a deletion of 4p16.2-p16.3 material, whereas five clones on the 11p subtelomeric region are shifted to the right, indicating a duplication of 11p15.5 material in the patient versus the reference DNA. The results of FISH analysis of metaphase chromosomes prepared from the patient's peripheral blood lymphocytes with probe RP11-371C18 specific for chromosome region 11p15.5 (red) show the presence of 11p15.5 material on the derivative chromosome 4 [der(4)] (arrow), whereas the results of FISH analysis with probe RP11-478C1 specific for chromosome region 4p16.3 (red) show the deletion of 4p16.3 material (arrow). The CMA and FISH analyses revealed an unbalanced translocation between 4p16 and 11p15. CMA profile of DNA from patient 2 tested on V5 BAC array (middle). As in patient 1, the 4p deletion and 11p duplication were detected by displacement of 11 clones and five clones on the corresponding region, respectively. The results of FISH analysis with the PAC probe RP5-998N23 (red) specific for 11p15.5 indicate the presence of 11p15.5 material on der(4), whereas the results of FISH analysis in patient 2 with the 4p subtelomeric probe D4S3359 (green) show the deletion of 4pter material. CMA profile of DNA from patient 3 tested on BAC emulated Version 6 OLIGO array (right) revealed the same genomic aberrations as patients 1 and 2. The results of FISH analysis with RP13-870H17 (red) specific for 11p15.5 indicate the presence of 11p15.5 material on der(4), whereas FISH analysis for patient 2 with probe RP11-613L20 specific for chromosome region 4p16.3 (red) show the deletion of 4p16.3 material. (B) Five t(4;11) cases mapped this to NAHR substrate pair. Summary of the sequence similarity BLAST2 analysis of the 350-kb sequence surrounding the 4p16.2 (top) and 11p15.4 (bottom) breakpoint regions. The different color horizontal arrows depict the homologous LCR subunits. The numbers above and below the lines represent genomic distance (megabases) from 4p and 11p telomeres, according to NCBI human genome build 37 (GRCh37/hg19; Feb. 2009). The regions between 4p16.2 and 11p15.4 connected by dotted lines are >94% sequence identical. The translocation breakpoints in patient 3 are located in the homologous LCRs indicated by the vertical arrows, implying a NAHR-based recombination mechanism. (C) Ethidium bromide stained agarose gel image of the ∼9-kb t(4;11) patient 3-specific junction fragment amplified by long-range PCR with primers harboring trans-morphisms specific for each 4p16.2 and 11p15.4 LCR (lane 2). Lane 1 represents the DNA marker with the 10-kb band indicated to the left. Lane 3 represents a negative control. (D) The NAHR cross-over site for patient 3 is located in a 130-kb subunit with 94.7% DNA sequence identity. UCSC Genome Browser view of the homologous LCR blocks of the same orientation in the chromosome regions 4p16.2 (top) and 11p15.4 (bottom) indicated by the gray bars. The black arrows indicate the NAHR site for patient 3 determined by sequence analysis. (E) DNA sequence alignment of the PCR amplified translocation junction fragment in patient 3 (middle sequence). The NAHR site was narrowed to a 24-bp segment (red rectangle) with 100% DNA sequence identity between chromosomes 4 (top) and 11 (bottom). Blue nucleotides indicate alignment with the chromosome 11 sequence, red nucleotides indicates alignment with the chromosome 4 sequence, purple nucleotides indicate SNPs, and trans-morphic mismatches are indicated by black dots above or below the sequence.
Figure 3.
Figure 3.
Potential outcomes of interchromosomal NAHR mediated by LCRs. Nonhomologous chromosomes are shown in black and white with the centromeres shown as circles. The arrows indicate the orientation of the LCRs. Only interchromosomal LCRs located in the same orientation on the same chromosomal arms (i.e., q-arm to q-arm) (A), or those in opposite orientation on different chromosomal arms (i.e., q-arm to p-arm) (C) are predicted to result in stable, monocentric reciprocal translocations. In contrast, LCRs located on the same chromosomal arm in opposite orientation (B) or on different chromosomal arms in the same orientation (D) would lead to unstable dicentric or acentric chromosomes, resulting in chromosome breakage or loss, respectively. Note: Both HR substrate orientation (direct versus inverted) and chromosomal arm location (p versus q), required for viable interchromosomal recombinant products.
Figure 4.
Figure 4.
Recurrent translocation map. A global genomic view of interchromosomal LCR pairs with >5 kb in size and >94% DNA sequence identity represented by dotted lines and distribution divided into four groups based on the size of LCR. To create this plot we circularized the genome using polar coordinates. We then connected points between a pair of chromosomes linked by LCRs satisfying our size sequence identify criteria (see Supplemental Table 3). The midpoints of the LCRs were used to identify each segment with a single location on each chromosome. The red dotted lines indicate the translocations identified in our patient database, while the green dotted lines represent the olfactory receptor LCRs. (A) The size of LCR ranges from 5030 to 9935 bases in the first 25%. (B) The size of LCRs range from 9936 to 16,593 bases for the second 25% of LCRs. (C) The size of LCRs range from 16,594 to 31,678 bases for the third 25% of LCRs. (D) The size of LCRs range from 31,679 to 754,003 bases for the final 25% of LCRs.
Figure 5.
Figure 5.
Identification of the LCR pairs acting as potential substrates for interchromosomal NAHR resulting in the t(8;12) formation. (A) CMA profiles of DNA from patients 5 (left) and 6 (right) tested on Version 8 OLIGO array (left) revealed a 7.9-Mb deletion of chromosome bands 8p23.1-pter and an 8.2-Mb duplication of chromosome bands 12p13.31-pter. The results of FISH analysis (right) with the probe RP11-440E12 (patient 5; red) or VIJTYAC14 (patient 6; green) specific for 12p33.33 indicate the presence of chromosome 12 material on the der(8), whereas the results of FISH analysis with probe RP11-1001A23 (patient 5; red) or D8S504 (patient 6; green) specific for the chromosome region 8p23 show the deletion on chromosome 8. (B) Two t(8;12) cases mapped this to NAHR substrate pair. Summary of the sequence similarity BLAST2 analysis of an ∼200-kb sequence surrounding the 8p23.1 and 12p13.31 breakpoint regions (bottom). (C) Ethidium bromide stained agarose gel image of the patient 5–specific ∼12-kb t(8;12) junction fragment amplified by long-range PCR with primers harboring trans-morphisms specific for each 8p23.1 and 12p13.31 LCR (lane 2). (Lane 1) The DNA marker with the 10-kb band indicated to the left. (Lane 3) A negative control. (D) The NAHR crossover site for patient 5 is located in a 7.7-kb subunit with 95.2% DNA sequence identity. UCSC Genome Browser view of the homologous LCR blocks in the 8p23.1 (top) and 12p13.31 (bottom) chromosome regions. (E) DNA sequence alignment of the PCR amplified translocation junction fragment for patient 6 (middle sequence). The NAHR site was narrowed to a 55-bp segment (red rectangle) with 100% sequence identity between chromosomes 8 (top, red) and 12 (bottom, blue).
Figure 6.
Figure 6.
The distributions of 1143 LCR potential substrate pairs with relation to chromosome position. For each chromosome, the distribution of the LCR (x-axis) is plotted against the frequency of the LCR (y-axis) along the entire chromosome. The red dotted vertical lines on both ends of the chromosome represent the first and last 5 Mb of each chromosome; the yellow line represents the centromeric region as aligned with the karyogram on the bottom of each graphic. The red hash marks underneath the plots depict the density of the LCRs, while the green bar represents the distribution of the 170 breakpoint regions from our genome-wide unbalanced translocation data.

References

    1. Abeysinghe SS, Chuzhanova N, Krawczak M, Ball EV, Cooper DN 2003. Translocation and gross deletion breakpoints in human inherited disease and cancer I: Nucleotide composition and recombination-associated motifs. Hum Mutat 22: 229–244 - PubMed
    1. Ashley T, Gaeth AP, Inagaki H, Seftel A, Cohen MM, Anderson LK, Kurahashi H, Emanuel BS 2006. Meiotic recombination and spatial proximity in the etiology of the recurrent t(11;22). Am J Hum Genet 79: 524–538 - PMC - PubMed
    1. Bailey JA, Yavor AM, Massa HF, Trask BJ, Eichler EE 2001. Segmental duplications: organization and impact within the current human genome project assembly. Genome Res 11: 1005–1017 - PMC - PubMed
    1. Baptista J, Mercer C, Prigmore E, Gribble SM, Carter NP, Maloney V, Thomas NS, Jacobs PA, Crolla JA 2008. Breakpoint mapping and array CGH in translocations: comparison of a phenotypically normal and an abnormal cohort. Am J Hum Genet 82: 927–936 - PMC - PubMed
    1. Baudat F, Buard J, Grey C, Fledel-Alon A, Ober C, Przeworski M, Coop G, de Massy B 2010. PRDM9 is a major determinant of meiotic recombination hotspots in humans and mice. Science 327: 836–840 - PMC - PubMed

Publication types

MeSH terms

Substances