
Association of a microRNA/TP53 feedback circuitry with pathogenesis and outcome of B-cell chronic lymphocytic leukemia

Muller Fabbri et al. JAMA. .

Erratum in

  • Incorrect Immunoblot in Figure.
    [No authors listed] [No authors listed] JAMA. 2025 Jul 8;334(2):184. doi: 10.1001/jama.2025.9581. JAMA. 2025. PMID: 40489316 Free PMC article. No abstract available.

Abstract

Context: Chromosomal abnormalities (namely 13q, 17p, and 11q deletions) have prognostic implications and are recurrent in chronic lymphocytic leukemia (CLL), suggesting that they are involved in a common pathogenetic pathway; however, the molecular mechanism through which chromosomal abnormalities affect the pathogenesis and outcome of CLL is unknown.

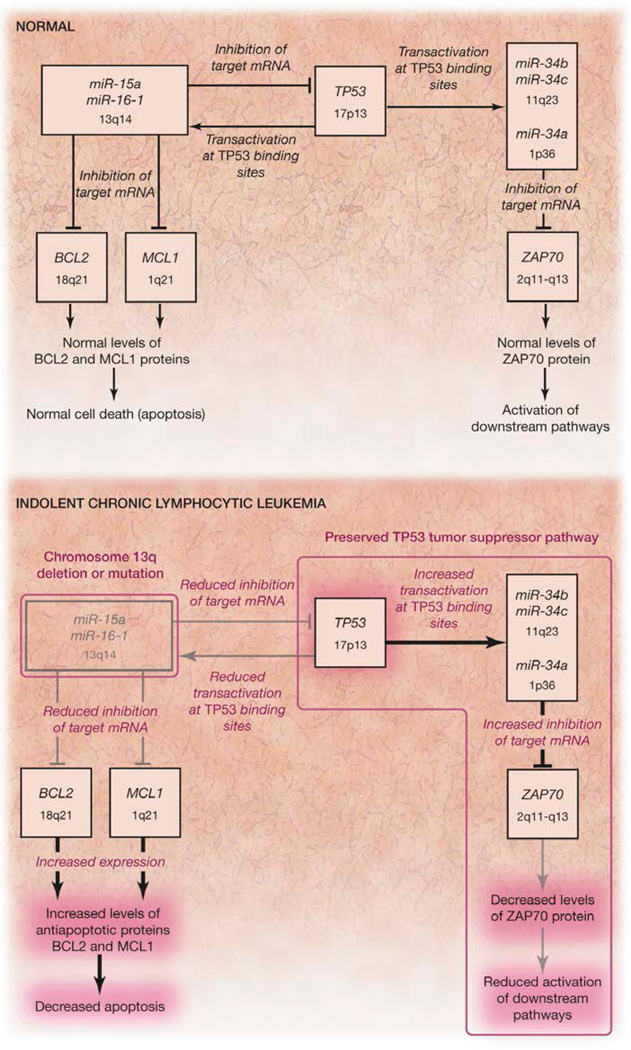
Objective: To determine whether the microRNA miR-15a/miR-16-1 cluster (located at 13q), tumor protein p53 (TP53, located at 17p), and miR-34b/miR-34c cluster (located at 11q) are linked in a molecular pathway that explains the pathogenetic and prognostic implications (indolent vs aggressive form) of recurrent 13q, 17p, and 11q deletions in CLL.

Design, setting, and patients: CLL Research Consortium institutions provided blood samples from untreated patients (n = 206) diagnosed with B-cell CLL between January 2000 and April 2008. All samples were evaluated for the occurrence of cytogenetic abnormalities as well as the expression levels of the miR-15a/miR-16-1 cluster, miR-34b/miR-34c cluster, TP53, and zeta-chain (TCR)-associated protein kinase 70 kDa (ZAP70), a surrogate prognostic marker of CLL. The functional relationship between these genes was studied using in vitro gain- and loss-of-function experiments in cell lines and primary samples and was validated in a separate cohort of primary CLL samples.

Main outcome measures: Cytogenetic abnormalities; expression levels of the miR-15a/miR-16-1 cluster, miR-34 family, TP53 gene, downstream effectors cyclin-dependent kinase inhibitor 1A (p21, Cip1) (CDKN1A) and B-cell CLL/lymphoma 2 binding component 3 (BBC3), and ZAP70 gene; genetic interactions detected by chromatin immunoprecipitation.

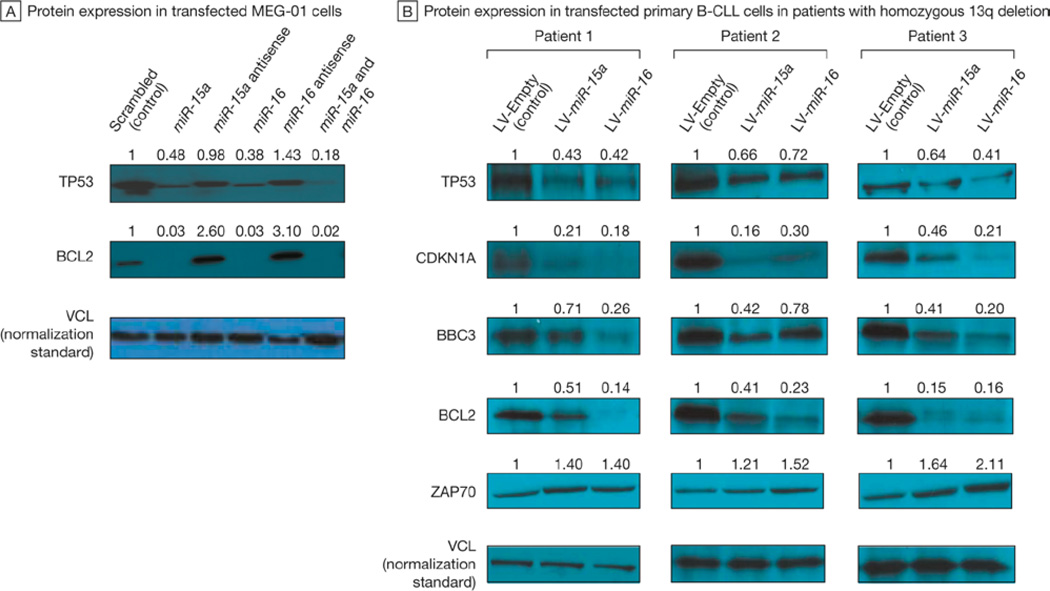
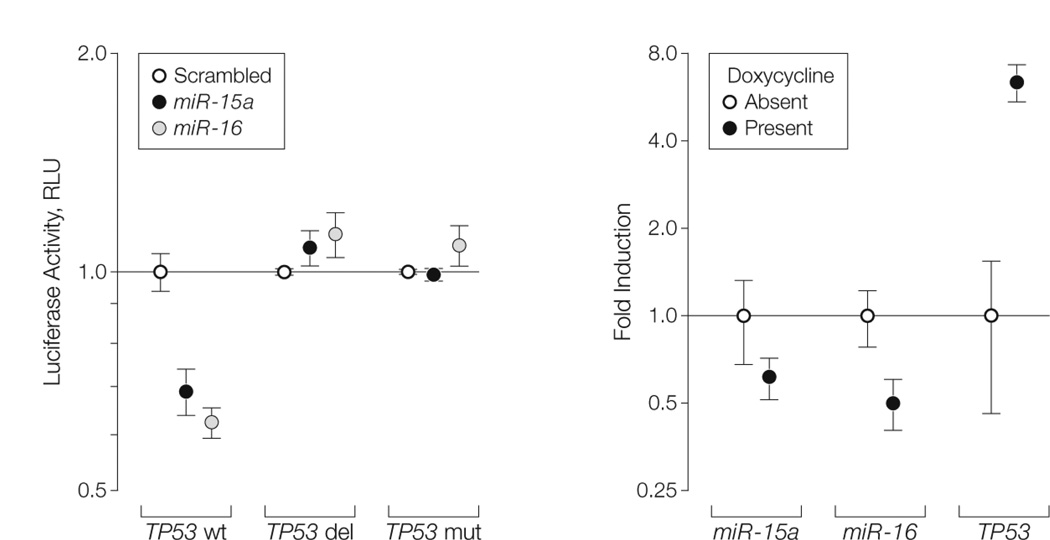
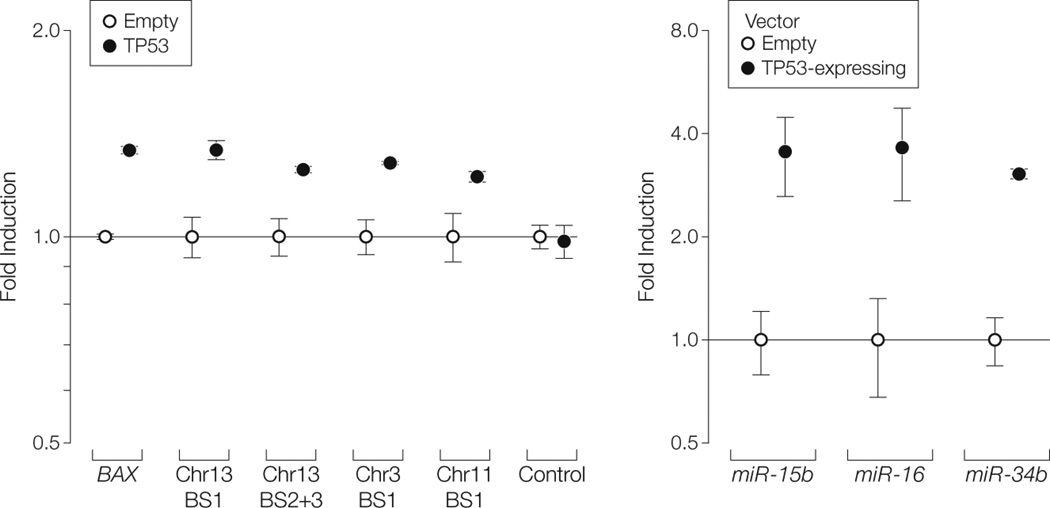
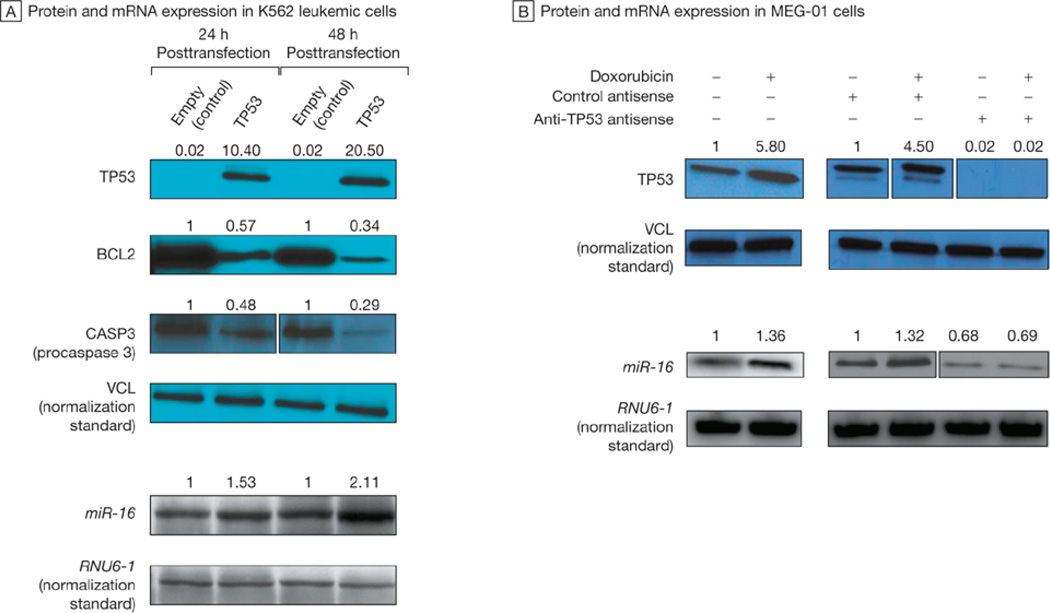
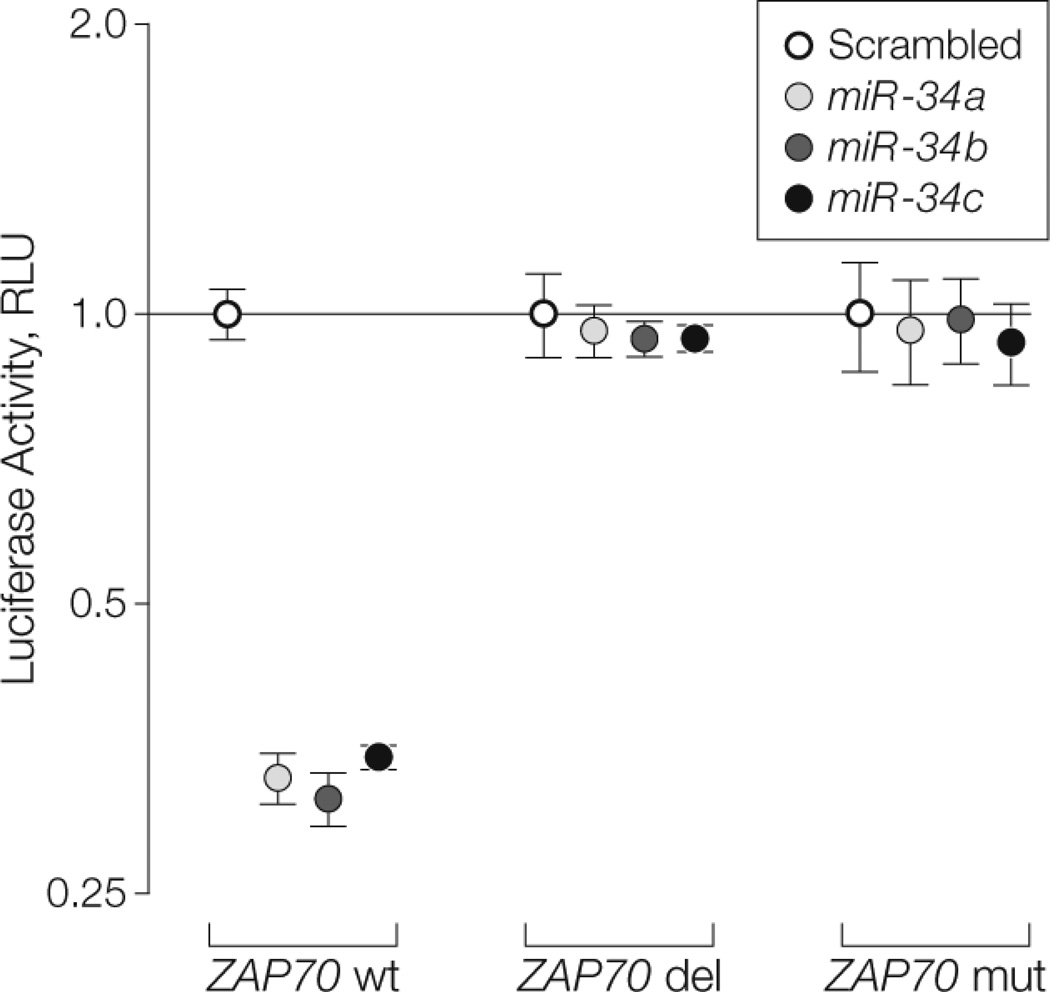
Results: In CLLs with 13q deletions the miR-15a/miR-16-1 cluster directly targeted TP53 (mean luciferase activity for miR-15a vs scrambled control, 0.68 relative light units (RLU) [95% confidence interval {CI}, 0.63-0.73]; P = .02; mean for miR-16 vs scrambled control, 0.62 RLU [95% CI, 0.59-0.65]; P = .02) and its downstream effectors. In leukemic cell lines and primary CLL cells, TP53 stimulated the transcription of miR-15/miR-16-1 as well as miR-34b/miR-34c clusters, and the miR-34b/miR-34c cluster directly targeted the ZAP70 kinase (mean luciferase activity for miR-34a vs scrambled control, 0.33 RLU [95% CI, 0.30-0.36]; P = .02; mean for miR-34b vs scrambled control, 0.31 RLU [95% CI, 0.30-0.32]; P = .01; and mean for miR-34c vs scrambled control, 0.35 RLU [95% CI, 0.33-0.37]; P = .02).

Conclusions: A microRNA/TP53 feedback circuitry is associated with CLL pathogenesis and outcome. This mechanism provides a novel pathogenetic model for the association of 13q deletions with the indolent form of CLL that involves microRNAs, TP53, and ZAP70.


Figures

FIGURE 1
FIGURE 1. Targeting of TP53 by miR-15a and miR-16 and Effects on TP53 Downstream Effectors in Cell Lines and Primary B-Cell Chronic Lymphocytic Leukemia (B-CLL) Samples
A, Immunoblots showing the protein expression of tumor protein p53 (TP53), B-cell CLL/lymphoma 2 (BCL2), and vinculin (VCL) in MEG-01 cells transfected with microRNA 15a (miR-15a), microRNA 16 (miR-16), their combination, or their antisense oligonucleotides. Cotransfection of miR-15a and miR-16-1 was performed at the same concentration of oligonucleotides per each; therefore, the total amount of transfected microRNAs was doubled with respect to the other lanes. VCL is the normalization standard used to normalize the amount of proteins loaded to each well. The numbers above the blots indicate the intensity of the band expressed as a ratio “gene product (TP53 or BCL2)/VCL” and normalized to “scrambled.” B, Immunoblots showing the protein expression of TP53, cyclin-dependent kinase inhibitor 1A (p21, Cip 1) (CDKN1A), BCL2 binding component 3 (BBC3), BCL2, zeta-chain (TCR)–associated protein minase 70 kDa (ZAP70), and VCL in primary B-cell CLL cells of 3 patients with CLL with a homozygous 13q deletion. Primary leukemic cells were stably infected with a lentiviral vector expressing miR-15a (LV- miR-15a), a lentiviral vector expressing miR-16-1 (LV- miR-16), or an empty lentiviral vector (LV-Empty). VCL is the normalization standard used to normalize the amount of proteins loaded to each well. The numbers above the blots indicate the intensity of the band expressed as ratio “gene product (TP53, CDKN1A, BBC3, BCL2 or ZAP70)/VCL” and normalized to “LV-Empty.
FIGURE 2
FIGURE 2. Targeting of TP53 by miR-15a and miR-16
A, Luciferase reporter assay (as means [error bars indicate 95% confidence intervals] of experiments conducted in sextuplicate) in cells cotransfected with wild-type tumor protein p53 (TP53) 3′-UTR (TP53 wt) and microRNA 15a (miR-15a) or 16 (miR-16). Luciferase activity normalized to scrambled; RLU indicates relative light units. TP53 del indicates deletion of miR-15a/miR-16 binding site on TP53 3′-UTR; TP53 mut indicates mutation of miR-15a/miR-16 binding site on TP53 3′-UTR. P values calculated for miR-15a and miR- 16 vs scrambled; values were statistically significant (P < .05) for TP53 wt comparisons only. B, Expression of miR-15a, miR-16, and TP53 messenger RNA (mRNA) in Tet-Off miR-15a/miR-16-1 – inducible HeLa cells as detected by quantified real-time polymerase chain reaction. Results presented as means (error bars indicate 95% confidence intervals) of experiments performed in triplicate. P values calculated for the cells in the presence of doxycycline (indicates reduced expression of the miR-15a/miR-16-1 cluster) vs the cells in the absence of doxycycline (indicates increased expression of the miR-15a/miR-16-1 cluster); all values were statistically significant (P < .05).
FIGURE 3
FIGURE 3. Transactivation of miR-15a/miR-16-1 and miR-34b/miR-34c Clusters by TP53
A, Promoter luciferase assay in tumor protein p53 (TP53)-null H1299 cells reported as means (error bars indicate 95% confidence intervals) of experiments performed in sextuplicate. The indicated TP53 binding site (BS) numbers correspond to those shown in red in eFigures 9 and 12. Control indicates the results obtained using the promoter vector with no binding site cloned in it. BAX indicates BCL2-associated X protein; Chr, chromosome. P values were calculated for TP53 vs empty for each group; all values were statistically significant (P < .05). B, Quantified real-time polymerase chain reaction (error bars indicate 95% confidence intervals) for microRNA 15b (miR-15b), microRNA 16 (miR-16), and microRNA 34b (miR-34b) performed on MEG-01 cells 24 hours after transfection with empty or TP53-expressing vectors. P values were calculated for TP53 vs empty for each group; all values were statistically significant (P < .05).
FIGURE 4
FIGURE 4. Transactivation of MicroRNA miR-16 Affecting Expression of miR-16 Targets
A, Northern blots showing messenger RNA (mRNA) expression of microRNA 16 (miR-16) and immunoblots showing the protein expression of tumor protein p53 (TP53), B-cell CLL/lymphoma 2 (BCL2), caspase 3, apoptosis-related cysteine peptidase (CASP3), and vinculin (VCL) in K562 leukemic cells 24 or 48 hours after transfection with an empty or TP53-expressing vector (TP53). VCL is the normalization standard used to normalize the amount of proteins loaded to each well. The numbers above the blots indicate the intensity of the band expressed as ratio “gene product (TP53, BCL2 or CASP3)/VCL” and normalized to “empty.” B, Immunoblots showing the protein expression of TP53 and VCL, and the Northern blots showing mRNA expression of miR-16 and RNA, U6 small nuclear 1 (RNU6-1 ), after doxorubicin-induced TP53 activation in MEG-01 cells. VCL and RNU6-1 are the normalization standards used to normalize the amount of proteins and RNA loaded to each well, respectively. The numbers above the blots indicate the intensity of the band expressed as ratio “TP53/VCL” or “ miR-16/RNU6-1 ” and normalized to untreated cells (left panels) and to anti-CTRL treated cells (right panels)..
FIGURE 5
FIGURE 5. Targeting of ZAP70 by miR-34a, miR-34b, and miR-34c
Luciferase reporter assay (as means [error bars indicate 95% confidence intervals] of experiments conducted in sextuplicate) in MEG-01 cells cotransfected with wild-type zeta-chain (TCR)–associated protein kinase 70kDa (ZAP70) binding site for microRNA 34 (miR-34) family (wt) and miR-34a, miR-34b, or miR-34c. Luciferase activity normalized to scrambled; RLU indicates relative light units. ZAP70 del indicates deletion of miR-34 binding site on ZAP70 coding region; ZAP70 mut indicates mutation of miR-34 binding site on ZAP70 coding region. P values calculated for miR-34a, miR- 34b, and miR-34c vs scrambled; values were significant (P < .05) for ZAP70 wt (wild-type) only.
FIGURE 6
FIGURE 6. MicroRNA/TP53 Pathogenetic Model for Human CLL
A novel pathogenetic model for chronic lymphocytic leukemia (CLL) showing a pathway of microRNAs and protein coding genes that are involved in the development of CLL. The microRNA 15a (miR-15a)/microRNA 16-1 (miR-16-1) cluster, the microRNA 34b (miR-34b)/microRNA 34c (miR-34c) cluster, and the genes tumor protein p53 (TP53), B-cell CLL/lymphoma 2 (BCL2), myeloid cell leukemia sequence 1 (BCL2-related) (MCL1), and zeta-chain (TCR)–associated protein kinase 70kDa (ZAP70) are the main partners in this model. mRNA indicates messenger RNA.

Comment in

References

    1. Call TG, Phyliky RL, Noel P, et al. Incidence of chronic lymphocytic leukemia in Olmsted County, Minnesota: 1935 through 1989, with emphasis on changes in initial stage at diagnosis. Mayo Clin Proc. 1994 Apr;69(4):323–328. - PubMed
    1. Rai KR, Sawitsky A, Cronkite EP, Chanana AD, Levy RN, Pasternack BS. Clinical staging of chronic lymphocytic leukemia. Blood. 1975 Aug;46(2):219–234. - PubMed
    1. Binet JL, Lepoprier M, Dighiero G, et al. A clinical staging system for chronic lymphocytic leukemia: prognostic significance. Cancer. 1977 Aug;40(2):855–864. - PubMed
    1. Dohner H, Stilgenbauer S, Benner A, et al. Genomic aberrations and survival in chronic lymphocytic leukemia. The New England Journal of Medicine. 2000 Dec 28;343(26):1910–1916. - PubMed
    1. Chiorazzi N, Rai KR, Ferrarini M. Chronic lymphocytic leukemia. The New England journal of medicine. 2005 Feb 24;352(8):804–815. - PubMed

Publication types

MeSH terms