. 2011 Jan 4:7:457.
doi: 10.1038/msb.2010.111.

Self-organized partitioning of dynamically localized proteins in bacterial cell division

Affiliations

Self-organized partitioning of dynamically localized proteins in bacterial cell division

Barbara Di Ventura et al. Mol Syst Biol. .

Abstract

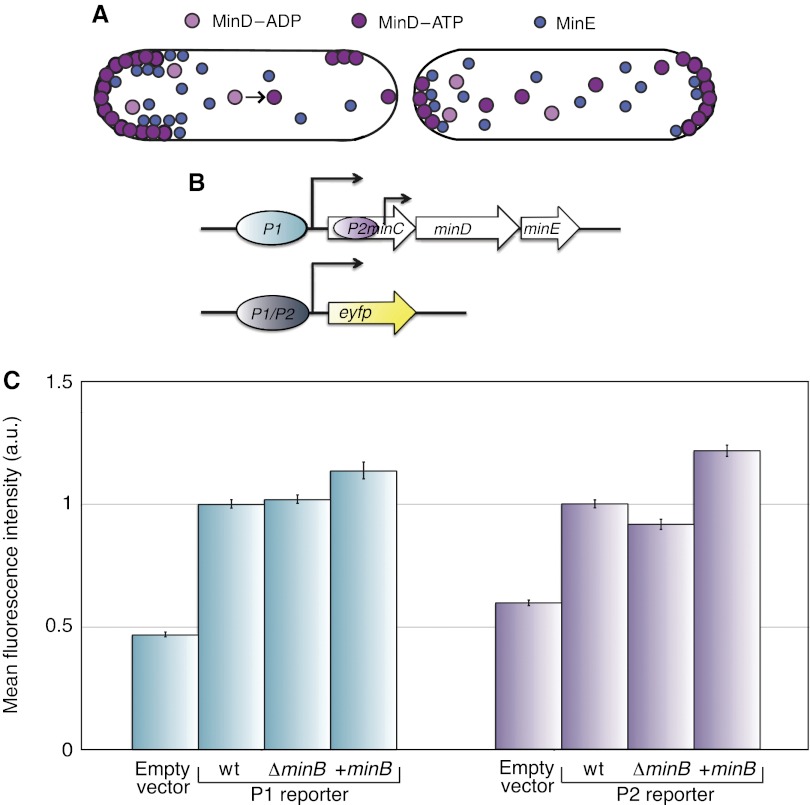
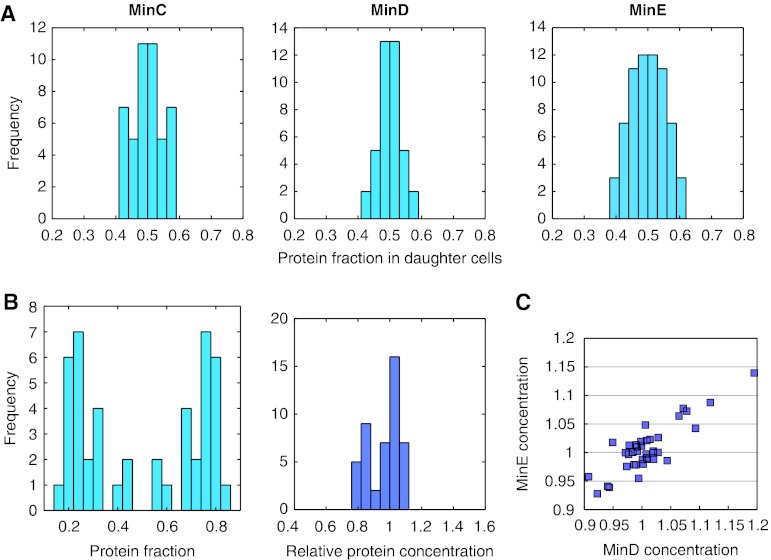
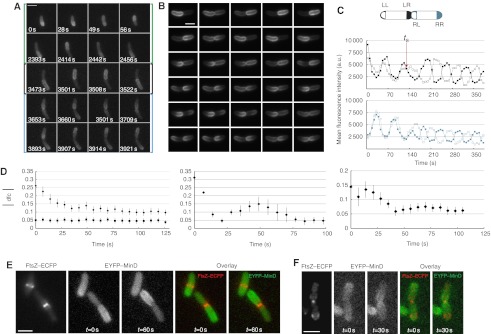
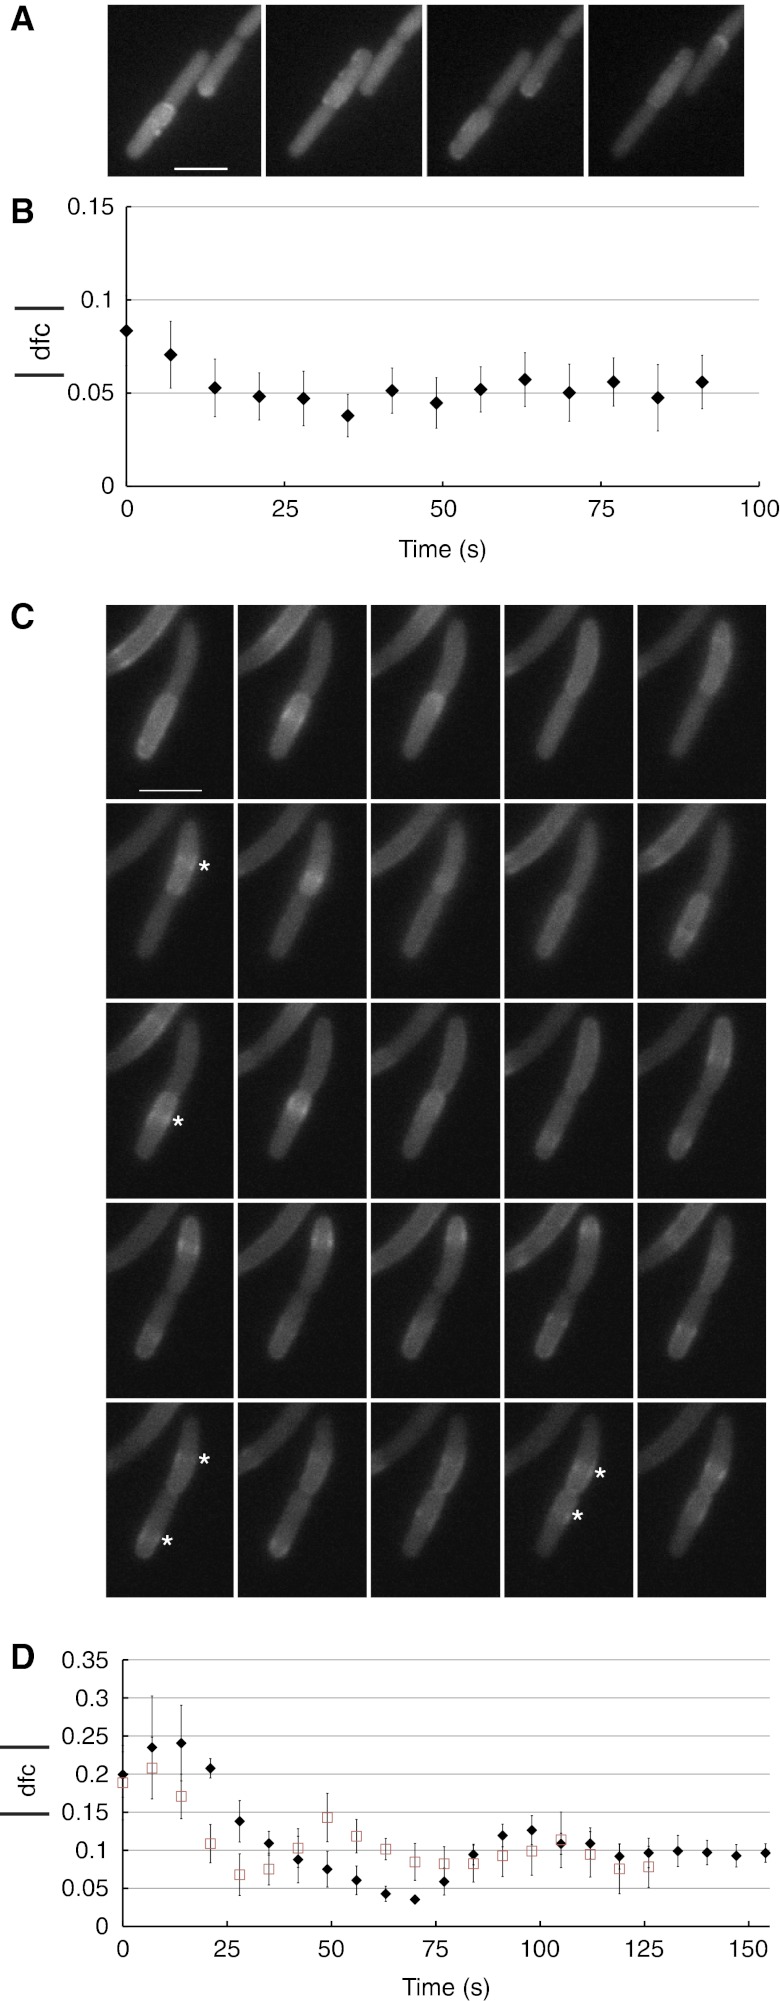
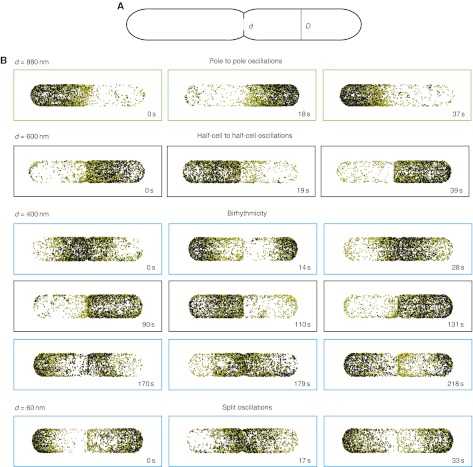
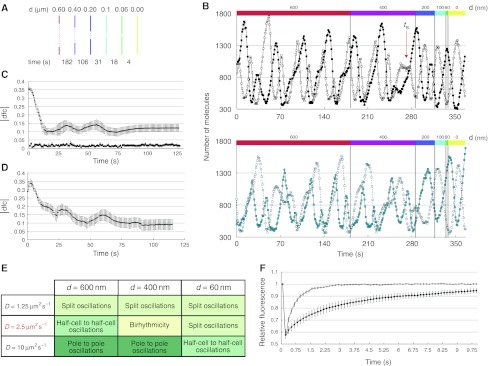
How cells manage to get equal distribution of their structures and molecules at cell division is a crucial issue in biology. In principle, a feedback mechanism could always ensure equality by measuring and correcting the distribution in the progeny. However, an elegant alternative could be a mechanism relying on self-organization, with the interplay between system properties and cell geometry leading to the emergence of equal partitioning. The problem is exemplified by the bacterial Min system that defines the division site by oscillating from pole to pole. Unequal partitioning of Min proteins at division could negatively impact system performance and cell growth because of loss of Min oscillations and imprecise mid-cell determination. In this study, we combine live cell and computational analyses to show that known properties of the Min system together with the gradual reduction of protein exchange through the constricting septum are sufficient to explain the observed highly precise spontaneous protein partitioning. Our findings reveal a novel and effective mechanism of protein partitioning in dividing cells and emphasize the importance of self-organization in basic cellular processes.


Conflict of interest statement

The authors declare that they have no conflict of interest.

Figures

Figure 1
Figure 1
Min proteins function and transcriptional regulation. (A) Schematic showing how the Min proteins self-organize into a spatial oscillator. See main text for more details. (B) Schematic of the minB operon organization in Escherichia coli. Two promoters controlling the expression of min genes are represented as ovals, with black arrows indicating the direction of transcription; genes are shown as open arrows. Bottom, schematic representation of the expression constructs used to study promoter activity. (C) Activity of indicated promoter constructs in wild-type (wt) MG1655, with or without overexpression of the minB operon, and in MG1655 [ΔminB]. Wild-type cells carrying the empty plasmid were analyzed as a negative control for background fluorescence. Cells were grown in LB medium at 37°C until early exponential phase. Values represent the mean±s.e.m. of data collected in two independent experiments. More than 100 cells were analyzed in each experiment. +minB indicates overexpression of the minB operon at 10 μM salicylate induction.
Figure 2
Figure 2
Distribution of Min proteins between divided daughter cells. (A) Distribution of fluorescently labeled Min proteins between daughter cells after division. Left panel, strain JW1165 (ΔminC) expressing EYFP–MinC (10 μM IPTG induction). Middle panel, strain JS964 (ΔminB) coexpressing GFP–MinD and MinE (50 μM IPTG induction) from one bicistronic construct. Right panel, strain PB114 (ΔminB) coexpressing MinD and MinE–EYFP (10 μM IPTG induction) from one bicistronic construct. The analysis was performed for pairs of daughter cells originating from the same mother cell. Histograms show the distribution of relative protein levels, defined as the fluorescence in each daughter cell divided by the sum fluorescence in the pair of daughter cells. (B) Distribution of relative concentrations, defined as fluorescence normalized by the cell area (right panel), or levels (left panel) of EYFP–MinD in daughter cells that divided asymmetrically. Both parameters were normalized to the total value in the pair of daughter cells. Asymmetric cell division was analyzed using strain JS964 (ΔminB) coexpressing GFP–MinD and MinE from one bicistronic construct (50 μM IPTG induction). (C) Correlation in relative single-cell concentrations of ECFP–MinD and MinE–EYFP, coexpressed from one bicistronic construct (10 μM IPTG induction) in strain PB114 (ΔminB). Points correspond to individual daughter cells. Source data is available for this figure at www.nature.com/msb.
Figure 3
Figure 3
Changes in MinD oscillations and protein equilibration between daughter cells during cytokinesis. (A) Changes in MinD oscillatory pattern during the cell cycle, shown for one representative cell. MG1655 cells expressing EYFP–MinD (30 μM IPTG induction) were synchronized (see Materials and methods) and then imaged for short periods at intervals of 7 s at the indicated time points. Green parentheses, pole to pole oscillations. Black parentheses, half-cell to half-cell oscillations. Cyan parentheses, split oscillations. (B) Representative cell of strain JS964 (ΔminB) coexpressing GFP–MinD and MinE (200 μM IPTG induction) showing the transition from half-cell-to-half-cell to split oscillations. Images were acquired every 7 s. Scale bars in A and B represent 3 μm. (C) Quantification of oscillations in a dividing cell. Top, Schematics of the regions used to quantify polar fluorescence in each future daughter cell. LL, left pole of the left daughter cell; LR, right pole of the left daughter cell; RL, left pole of the right daughter cell; RR, right pole of the right daughter cell. Middle and bottom, Fluorescence intensity curves obtained for individual poles of a left daughter cell (middle) and right daughter cell (bottom). Symbol color and filling are as in the top panel. The red arrow indicates the time at which oscillations split between daughter cells (ts). (D) Kinetics of equilibration of EYFP–MinD (diamonds) levels after oscillation splitting indicated by the absolute value of the difference (dfc) between relative protein levels in the two future daughter cells. Equilibration was followed in strain MG1655 expressing EYFP–MinD at 30 μM IPTG (left), or in strain JS964 (ΔminB) coexpressing GFP–MinD and MinE at 200 (middle) or 50 μM (right) IPTG induction. A freely diffusing cytosolic protein, EYFP, is shown as a control (squares) in the left panel. To define the time of splitting in the latter case, EYFP (10 μM salicylate induction) was coexpressed with ECFP–MinD (30 μM IPTG induction). Values represent averages of 22 (left), 5 (middle) and 15 (right) dividing cells, aligned by the time of splitting. Error bars represent s.e.m. Left panel, cells were synchronized before microscopic analysis (see Materials and methods). (E, F) Correlation between septum size and half-cell to half-cell (E) or split oscillations (F). MG1655 cells coexpressing FtsZ–ECFP and EYFP–MinD and MinE from a EYFP–MinDE bicistronic construct were analyzed by time-lapse microscopy to determine the oscillatory MinD pattern and an image of FtsZ–ECFP was taken afterwards to quantify the septum size. Images show the overlay between the YFP and CFP channels. Scale bar represents 3 μm. MinD and MinE were induced using 0.01% arabinose for 3 h, while FtsZ was induced with 5 μM IPTG for 40 min. Source data is available for this figure at www.nature.com/msb.
Figure 4
Figure 4
Behavior of MinC and MinE during cell division. (A) Half-cell to half-cell oscillations in a representative cell of strain JW1165 (ΔminC) expressing EYFP–MinC. (B) Equilibration of EYFP–MinC in strain JW1165 during cytokinesis. (C) Transition from half-cell-to-half-cell to split oscillations in a representative cell of strain PB114 (ΔminB) coexpressing untagged MinD and MinE–EYFP. Asterisks, E-ring. (D) Equilibration of MinE–EYFP during cytokinesis in strain PB114 (black diamonds) or MG1655 (red squares) coexpressing MinD and MinE–EYFP. Induction levels were 10 μM IPTG in all experiments. Values represent averages of 9 (B), 4 (D, black diamonds) and 6 (D, red squares) dividing cells, aligned by the time of splitting. Images were acquired every 7 s. The scale bars represent 3 μm. Error bars represent s.e.m. Source data is available for this figure at www.nature.com/msb.
Figure 5
Figure 5
Simulations of a 3D stochastic model of the Min system at different degrees of septum constriction. (A) Schematic planar view of the 3D geometry used to simulate the stochastic model of the Min system using the software MesoRD. D, cell width (1 μm); d, septum width. Cell length, 6 μm. (B) Results of the simulation runs with the indicated fixed septum size. Black dots, MinD molecules on the membrane; yellow dots, MinDE complex on the membrane. Green boxes, pole to pole oscillatory regime; black boxes, half-cell to half-cell oscillatory regime; cyan boxes, split oscillations. For a septum width of 400 nm two oscillatory regimes alternate with each other, showing birhythmicity. Time at 0 s does not indicate the beginning of the simulation, but rather the time point to which the subsequent snapshots are referred. For each septum size, five independent simulations of 2000 s were run. Source data is available for this figure at www.nature.com/msb.
Figure 6
Figure 6
Simulations of the 3D stochastic model of the Min system during cytokinesis. (A) Schematic of the septum sizes and their corresponding simulation times used in the cytokinesis model. The times were calculated using the equation:formula image where d is the septum size, D is the cell width (1 μm), τc is the time at which constriction starts (10 min) and τg is the time between successive divisions (30 min). (B) Results of one simulation of the cytokinesis model showing the number of MinD molecules in each polar region as a function of time. Colors and symbols are as in Figure 3C. (C) Absolute value of the difference (dfc) between molecule numbers of MinD (diamonds) or of a cytoplasmic protein (squares) in the virtual daughter cells during cytokinesis. Means were calculated over 11 independent simulations. Error bars represent the s.e.m. (D) Equilibration of MinE, plotted as in (C). (E) Table showing the relation between diffusion coefficient and oscillatory regime obtained in the simulations of a cell with the indicated septum size. In red, default diffusion coefficient. Five independent simulations of 2000 s were run for each diffusion coefficient value. (F) FRAP analysis for HtpG–EYFP fusion performed on unconstricted (open diamonds) and constricted (filled squares) cells (see Materials and methods). MG1655 cells carrying the plasmid for the expression of the fusion protein were induced at early exponential growth phase with 100 μM IPTG for 3 h. Curves show the fluorescence recovery averaged over 20 unconstricted or constricted cells of similar mean length (4.8 and 5 μm, respectively). Source data is available for this figure at www.nature.com/msb.
Figure 7
Figure 7
Model of Min proteins partitioning during cell division. For simplicity, only MinD molecules on the membrane are shown. Cell division progress is shown from top to bottom. Oscillatory regime corresponding to the cellular geometry is indicated at the top of each cellular stage. We propose that oscillations split before completion of cytokinesis, which allows initial separation and subsequent fast equilibration of proteins levels between daughter cells. As depicted in the figure, slow protein exchange through the gradually constricting septum is key to this partitioning mechanism.

References

    1. Ames P, Studdert CA, Reiser RH, Parkinson JS (2002) Collaborative signaling by mixed chemoreceptor teams in Escherichia coli. Proc Natl Acad Sci USA 99: 7060–7065 - PMC - PubMed
    1. Baba T, Ara T, Hasegawa M, Takai Y, Okumura Y, Baba M, Datsenko KA, Tomita M, Wanner BL, Mori H (2006) Construction of Escherichia coli K-12 in-frame, single-gene knockout mutants: the Keio collection. Mol Syst Biol 2: 2006.0008; DOI: 10.1038/msb4100050 - DOI - PMC - PubMed
    1. Blattner FR, Plunkett G III, Bloch CA, Perna NT, Burland V, Riley M, Collado-Vides J, Glasner JD, Rode CK, Mayhew GF, Gregor J, Davis NW, Kirkpatrick HA, Goeden MA, Rose DJ, Mau B, Shao Y (1997) The complete genome sequence of Escherichia coli K-12. Science 277: 1453–1462 - PubMed
    1. Burkard ME, Maciejowski J, Rodriguez-Bravo V, Repka M, Lowery DM, Clauser KR, Zhang C, Shokat KM, Carr SA, Yaffe MB, Jallepalli PV (2009) Plk1 self-organization and priming phosphorylation of HsCYK-4 at the spindle midzone regulate the onset of division in human cells. PLoS biology 7: e1000111. - PMC - PubMed
    1. Chen JC, Beckwith J (2001) FtsQ, FtsL and FtsI require FtsK, but not FtsN, for co-localization with FtsZ during Escherichia coli cell division. Mol Microbiol 42: 395–413 - PubMed

Publication types