

Dynamic transcriptome analysis measures rates of mRNA synthesis and decay in yeast
- PMID: 21206491
- PMCID: PMC3049410
- DOI: 10.1038/msb.2010.112
Dynamic transcriptome analysis measures rates of mRNA synthesis and decay in yeast
Abstract
To obtain rates of mRNA synthesis and decay in yeast, we established dynamic transcriptome analysis (DTA). DTA combines non-perturbing metabolic RNA labeling with dynamic kinetic modeling. DTA reveals that most mRNA synthesis rates are around several transcripts per cell and cell cycle, and most mRNA half-lives range around a median of 11 min. DTA can monitor the cellular response to osmotic stress with higher sensitivity and temporal resolution than standard transcriptomics. In contrast to monotonically increasing total mRNA levels, DTA reveals three phases of the stress response. During the initial shock phase, mRNA synthesis and decay rates decrease globally, resulting in mRNA storage. During the subsequent induction phase, both rates increase for a subset of genes, resulting in production and rapid removal of stress-responsive mRNAs. During the recovery phase, decay rates are largely restored, whereas synthesis rates remain altered, apparently enabling growth at high salt concentration. Stress-induced changes in mRNA synthesis rates are predicted from gene occupancy with RNA polymerase II. DTA-derived mRNA synthesis rates identified 16 stress-specific pairs/triples of cooperative transcription factors, of which seven were known. Thus, DTA realistically monitors the dynamics in mRNA metabolism that underlie gene regulatory systems.
Conflict of interest statement
The authors declare that they have no conflict of interest.
Figures
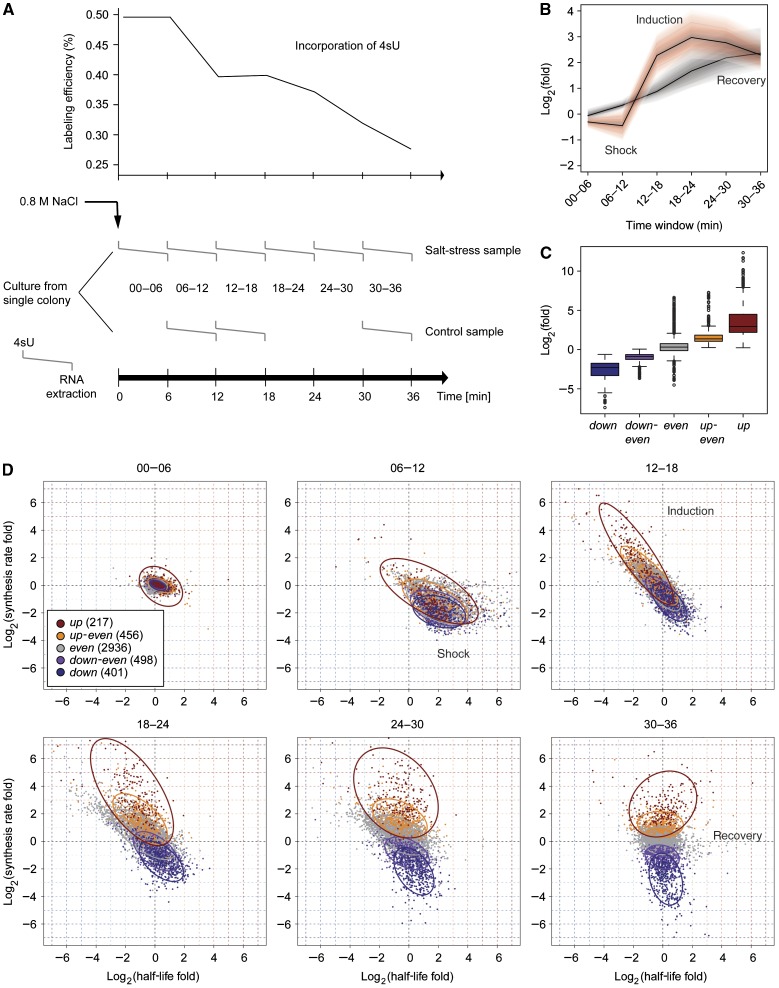
 ) corresponds to one sample, left end marks the start of the 4sU labeling, right end marks the time of mRNA extraction. Upper panel shows the drop in labeling efficiency from roughly one 4sU in 200 uridines to one 4sU in 400 uridines during the osmotic stress response. (B) Increased sensitivity and temporal resolution of DTA compared with standard transcriptomics. Gray, time course of the total mRNA fraction of the Hog1-induced genes (Capaldi et al, 2008). Red, time course of the synthesis rates of the same gene set. The solid lines represent the time course of the median, the shaded bands are the central 95% regions. In contrast to the monotonically increasing total mRNA time course, the synthesis rates clearly show three response phases. (C) Expression changes of the five clusters (up, up-even, even, down-even, down—see Materials and methods) that were defined in a normalization-independent manner. The box plot shows synthesis rate folds (30 versus 0 min). (D) Dynamics of synthesis and decay rates in the osmotic stress time series. Each diagram corresponds to one time point. Each point corresponds to one gene, which is colored according to its affiliation with one of the clusters in (C). Ellipses show the 75% regions of highest density within each cluster, assuming Gaussian distributions. The shape of the ellipses indicates the correlation structure within a cluster.
References
-
- Alon U (2006) An Introduction to Systems Biology: Design Principles of Biological Circuits. Boca Raton, Florida: Chapman & Hall/CRC Press
-
- Andrau JC, van de Pasch L, Lijnzaad P, Bijma T, Koerkamp MG, van de Peppel J, Werner M, Holstege FC (2006) Genome-wide location of the coactivator mediator: Binding without activation and transient Cdk8 interaction on DNA. Mol Cell 22: 179–192 - PubMed
-
- Brueckner F, Hennecke U, Carell T, Cramer P (2007) CPD damage recognition by transcribing RNA polymerase II. Science 315: 859–862 - PubMed
Publication types
MeSH terms
Substances
LinkOut - more resources
Full Text Sources
Other Literature Sources
Molecular Biology Databases
