. 2011 Mar 11;286(10):8677-8687.
doi: 10.1074/jbc.M110.194860. Epub 2011 Jan 5.

Inhibition of beta-secretase in vivo via antibody binding to unique loops (D and F) of BACE1

Affiliations

Inhibition of beta-secretase in vivo via antibody binding to unique loops (D and F) of BACE1

Lujia Zhou et al. J Biol Chem. .

Abstract

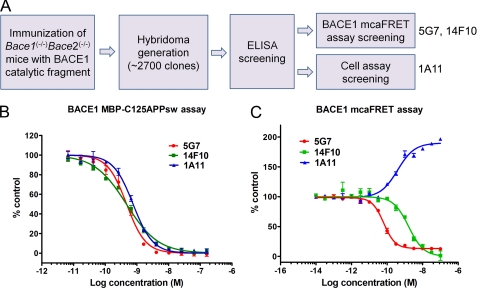
β-Secretase (BACE1) is an attractive drug target for Alzheimer disease. However, the design of clinical useful inhibitors targeting its active site has been extremely challenging. To identify alternative drug targeting sites we have generated a panel of BACE1 monoclonal antibodies (mAbs) that interfere with BACE1 activity in various assays and determined their binding epitopes. mAb 1A11 inhibited BACE1 in vitro using a large APP sequence based substrate (IC(50) ∼0.76 nm), in primary neurons (EC(50) ∼1.8 nm), and in mouse brain after stereotactic injection. Paradoxically, mAb 1A11 increased BACE1 activity in vitro when a short synthetic peptide was used as substrate, indicating that mAb 1A11 does not occupy the active-site. Epitope mapping revealed that mAb 1A11 binds to adjacent loops D and F, which together with nearby helix A, distinguishes BACE1 from other aspartyl proteases. Interestingly, mutagenesis of loop F and helix A decreased or increased BACE1 activity, identifying them as enzymatic regulatory elements and as potential alternative sites for inhibitor design. In contrast, mAb 5G7 was a potent BACE1 inhibitor in cell-free enzymatic assays (IC(50) ∼0.47 nm) but displayed no inhibitory effect in primary neurons. Its epitope, a surface helix 299-312, is inaccessible in membrane-anchored BACE1. Remarkably, mutagenesis of helix 299-312 strongly reduced BACE1 ectodomain shedding, suggesting that this helix plays a role in BACE1 cellular biology. In conclusion, this study generated highly selective and potent BACE1 inhibitory mAbs, which recognize unique structural and functional elements in BACE1, and uncovered interesting alternative sites on BACE1 that could become targets for drug development.


Figures

FIGURE 1.
FIGURE 1.
Hybridoma screening and characterization of mAbs in enzymatic assays. A, schematic representation of hybridoma screening for BACE1 inhibitory mAbs. Three candidates were selected for further analysis: mAbs 5G7 and 14F10 were identified from mcaFRET assay screening, mAb 1A11 was identified from cell assay screening. B, inhibition of BACE1 by the mAbs 5G7, 14F10, and 1A11 in BACE1 MBP-C125APPsw assay. Values are mean ± S.D.; n = 3. The substrate is a fusion protein of MBP and 125 amino acids of the C terminus of human APP containing the Swedish double mutation. The IC50 values for mAbs 5G7, 14F10, and 1A11 are 0.47 nm (95% CI: 0.41- 0.55 nm), 0.46 nm (95% CI: 0.42 - 0.52 nm), and 0.76 nm (95% CI: 0.67–0.85 nm), respectively. C, modulation of BACE1 activity in mcaFRET assay. Values are mean ± S.D.; n = 3. The substrate is a small FRET peptide MCA-SEVENLDAEFRK(Dnp)-RRRR-NH2. The IC50 (or EC50) values for 5G7, 14F10, and 1A11 are 0.06 nm (95% CI: 0.055–0.075 nm), 1.6 nm (95% CI: 1.2–2.1 nm), and 0.38 nm (95% CI: 0.27–0.55 nm), respectively.
FIGURE 2.
FIGURE 2.
Inhibition of BACE1 by mAb 1A11 in primary neurons derived from wild-type mouse embryos. A, cultured neurons were infected with SFV expressing WT human APP695 and treated with 200 nm mAb 1A11, 5G7, or 14F10 (diluted in PBS). Compound 3 was used as a positive control (B1 inhibitor). Cell extracts or conditioned media were analyzed by Western blot (10% Bis-Tris SDS-PAGE) using antibodies 22C11 (sAPPtotal), B63 (full-length APP, C99, and C83), anti-sAPPβ (sAPPβ), and WO2 (Aβ). Notice the appearance of a δ-CTF (indicated with an arrow), see main text for the descriptions. B, cultured neurons infected with human APP695 were treated with decreasing concentrations of mAb 1A11 ranged from 20 to 0.16 nm. Conditioned media were analyzed by ELISAs for Aβlevels; Values are mean ± S.D.; n = 3. The EC50 values were estimated from the inhibition curves of Aβ1–42 and Aβ1–40 as 1.8 nm (95% IC: 1.5–2.2 nm) and 1.6 nm (95% IC: 1.4–1.8 nm), respectively, which are statistically not different. C, representative Western blots (10% Bis-Tris SDS-PAGE) showing the mAb 1A11 dose-dependent inhibition on sAPPβ and C99 generation.
FIGURE 3.
FIGURE 3.
Inhibition of BACE1 activity in APP-overexpressing mice by stereotactic administration of mAb 1A11 into the hippocampus/cortex. mAb 1A11 (4 μg) or mouse Isotype control IgG1 was injected into the hippocampus/cortex of APPDutch mice. Brain samples were collected 24 h after injection. Guanidine HCl extractions were analyzed by ELISAs for Aβ1–40 (A) and Aβ1–42 (B), or subjected to immunoprecipitation and Western blot using B63 antibody for full-length APP and its C-terminal fragments (CTFs). C99 and APP levels were quantified from Western blots and normalized to full-length APP expression levels (C). Values are mean ± S.E.; ***, p < 0.0001; t-test; n = 11 (control IgG) or n = 13 (mAb 1A11). D, representative Western blot (16% Tricine SDS-PAGE) showing the expression levels of full-length APP and the levels of different APP CTFs from mice injected with control IgG (lanes 1–4) or mAb 1A11 (lanes 5–8). E, immunoprecipitates of full-length APP and its CTFs from brain extractions of control APPDutch mice were treated without (lane 1) or with (lane 2) lambda protein phosphatase (LPP) and analyzed by Western blot using B63 antibody (16% Tricine SDS-PAGE). Please see text for the detailed description of the different APP CTF bands.
FIGURE 4.
FIGURE 4.
Epitope mapping of mAb 1A11. A, scheme for immunogen BACE1 46–460 (1) and the fragments (2–9). The numbers on the fragments represent the amino acids corresponding to full length human BACE1 protein. B, Western blot analysis (10% Bis-Tris SDS-PAGE) of mAb 1A11 against purified GST-BACE1 fragments. Immunogen BACE1 46–460 (1) and fragments BACE1 240–460 (4), 314–460 (8) are immunoreactive, whereas all the other fragments are not (upper panel). The anti-GST antibody recognizes all of these recombinant proteins (lower panel). C, scheme for loops D (residues 332–342) and F (residues 371–378) within BACE1 314–460 sequence (upper part). The three-dimensional structures of loops D and F were created using the PDB file 2G94 (lower part). D and E, mutagenesis of residues 332QAG334 to AGA (on loop D) or residues 376SQD378 to WAA (on loop F) abolishes immunoreactivity of mAb 1A11 to these GST-BACE1 mutants in Western blots.
FIGURE 5.
FIGURE 5.
Enzymatic activities of purified BACE1 mutants. A, representative Coomassie staining (4–12% Bis-Tris SDS-PAGE) of the WT, Δhelix A, and Δloop F mutant BACE1:Fc (∼97 kDa) purified from HEK293 cell cultures. B, initial rates were determined for WT and mutant BACE1. Substrate concentrations used in mcaFRET assay and MBP-C125APPsw assays were 30 μm and 50 nm, respectively. Values are mean ± S.E.; n = 4; ***, p < 0.0001; Paired t-test.
FIGURE 6.
FIGURE 6.
The binding epitope of mAb 5G7 is inaccessible from membrane-anchored BACE1 under native condition. A, cell surface staining of HEK293 cells stably expressing BACE1 using mAb 5G7 or 1A11. Staining was performed either with living cells at 4 °C (native condition) or after fixation with 4% paraformaldehyde. mAb 5G7 did not react to cell surface BACE1 under native condition. B, immunoprecipitation of membrane-bound BACE1 (total or cell surface after biotinylation) solublized in 1% CHAPSO, or shed BACE1 ectodomain from conditioned medium using mAb 5G7 or 1A1. Immunoprecipitates were analyzed by Western blots using either mAb 10B8 (epitope located within 46–240 aa of BACE1) for total BACE1 and shed BACE1 ectodomain, or using Streptavidin-HRP conjugate for cell surface BACE1. Notice that the blots do not show the relative amount of different forms of cellular BACE1. See Fig. 7 for the relative amount of shed and total BACE1. C, three-dimensional structure of BACE1 (created using PDB file 1FKN). Structures including loops D, F (residues 332–342, 371–378), helix A (residues 219–232), and helix 299–312 are indicated in pink, green, and yellow, respectively. mAbs 5G7 and 1A11 immunoreact with residues K299/E303/Q386 and 332QAG334/376SQD378, respectively.
FIGURE 7.
FIGURE 7.
Mutagenesis of helix 299–312 reduced shedding of BACE1 ectodomain from HEK293 cells. A, protein sequence alignment of helix 299–312 on BACE1 and corresponding helix 313–326 on BACE2. B, wild-type BACE1 or mutants of the helix: M1 (K299/E303/K307/K310/A311 to Q/D/E/A/R) and M2 (K307/K310/A311 to E/A/R) were expressed in HEK293 cells. Conditioned media were analyzed by immunoprecipitation and Western blots for shed BACE1 ectodomain using mAb 10B8 (epitope located within 46–240 aa of BACE1); Cell extracts (10%) were loaded on the same blot for detection of total BACE1. The upper and lower panels are short and long exposure of the blot, respectively.
FIGURE 8.
FIGURE 8.
Maturation and turnover of BACE1 mutants. HEK293 cells expressing wild-type BACE1, helix 307–311 mutant (K307/K310/A311 to E/A/R) or helix 299–311 mutant (K299/E303/K307/K310/A311 to Q/D/E/A/R) were pulse-labeled for 10 min with [35S]methionine/cysteine and chased in growth medium for the indicated amount of time. BACE1 was immunoprecipitated with mAb 10B8 (epitope located within 46–240 aa of BACE1) and detected by autoradiography (A). Plots (B–D) showing the kinetics of BACE1 maturation and turnover. Immature, mature and total BACE1 are presented as a percentage of maximum total BACE1. Plot (E) compares the turnover of mature BACE1 between wild-type BACE1 and helix mutants. Mature BACE1 is presented as a percentage of maximum wild-type mature BACE1. The plots show the results of two independent experiments.

Similar articles

Cited by

References

    1. Hardy J., Selkoe D. J. (2002) Science 297, 353–356 - PubMed
    1. Golde T. E., Dickson D., Hutton M. (2006) Curr. Alzheimer Res. 3, 421–430 - PubMed
    1. Selkoe D. J. (2001) Physiol. Rev. 81, 741–766 - PubMed
    1. Hussain I., Powell D., Howlett D. R., Tew D. G., Meek T. D., Chapman C., Gloger I. S., Murphy K. E., Southan C. D., Ryan D. M., Smith T. S., Simmons D. L., Walsh F. S., Dingwall C., Christie G. (1999) Mol. Cell Neurosci. 14, 419–427 - PubMed
    1. Sinha S., Anderson J. P., Barbour R., Basi G. S., Caccavello R., Davis D., Doan M., Dovey H. F., Frigon N., Hong J., Jacobson-Croak K., Jewett N., Keim P., Knops J., Lieberburg I., Power M., Tan H., Tatsuno G., Tung J., Schenk D., Seubert P., Suomensaari S. M., Wang S., Walker D., Zhao J., McConlogue L., John V. (1999) Nature 402, 537–540 - PubMed

Publication types

MeSH terms

Substances

LinkOut - more resources