. 2011 Jan 5;31(1):55-63.
doi: 10.1523/JNEUROSCI.4637-10.2011.

Information capacity and transmission are maximized in balanced cortical networks with neuronal avalanches

Affiliations

Information capacity and transmission are maximized in balanced cortical networks with neuronal avalanches

Woodrow L Shew et al. J Neurosci. .

Abstract

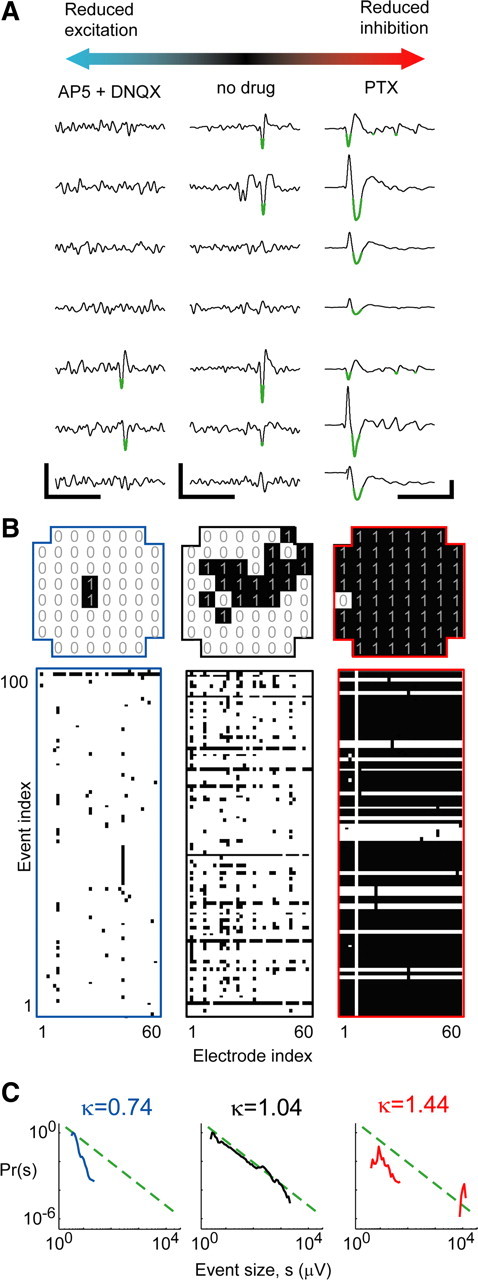
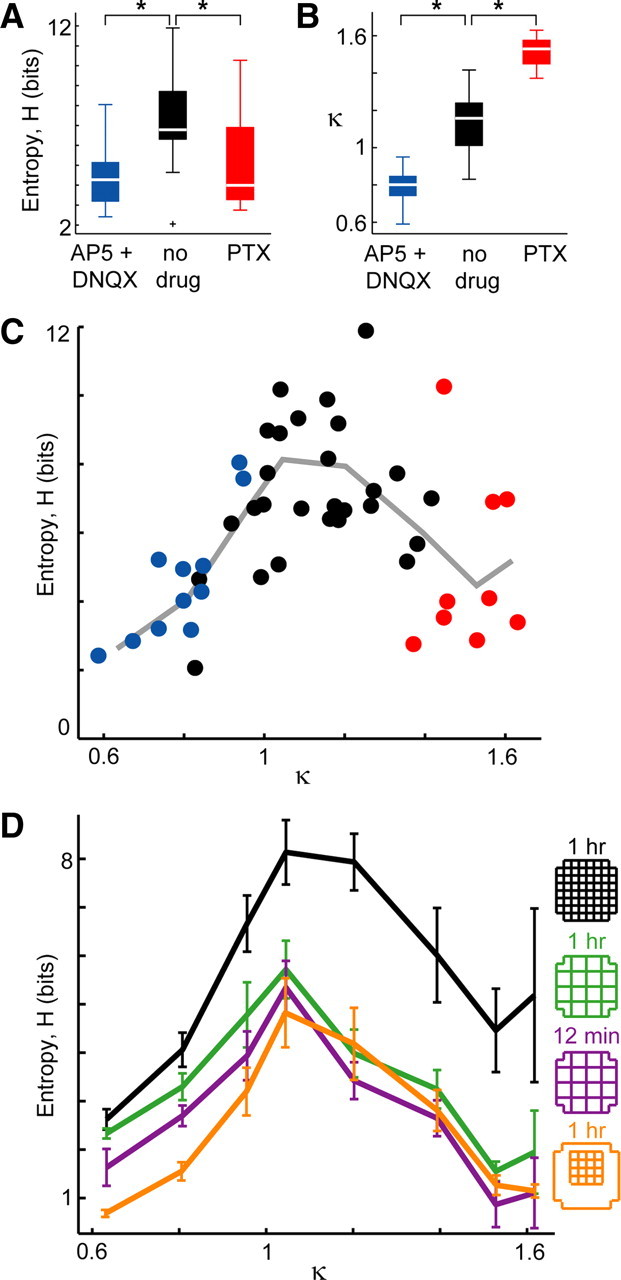
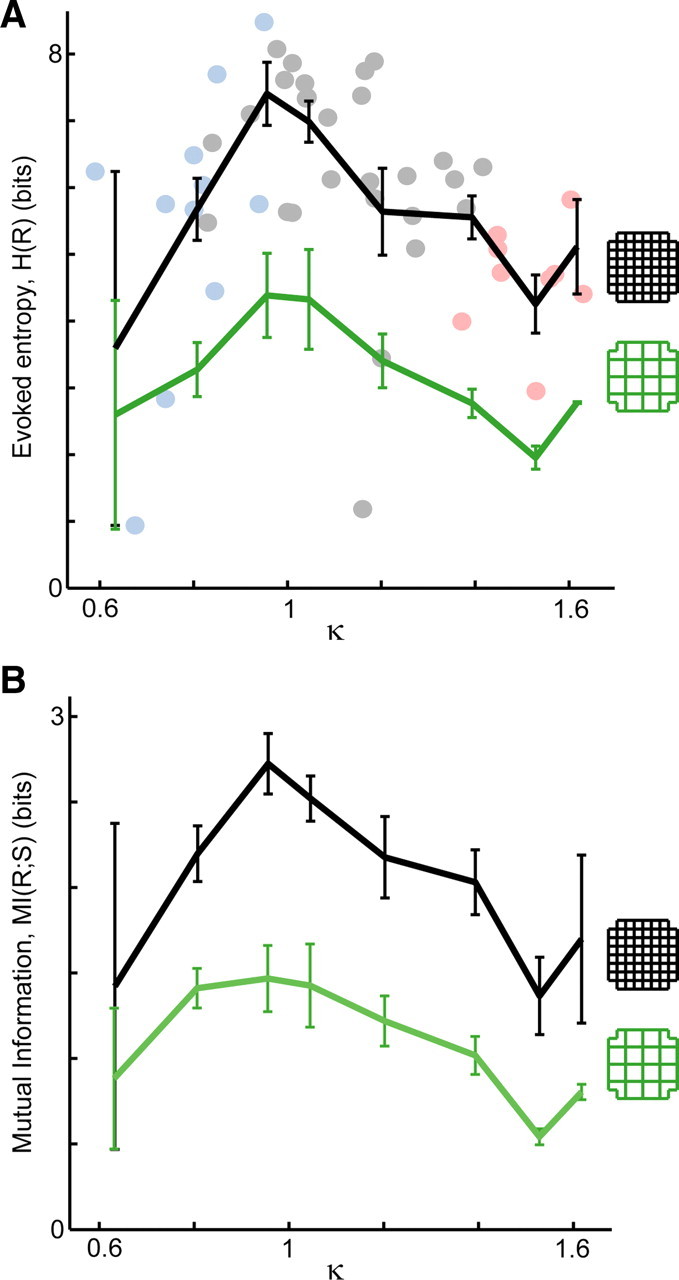
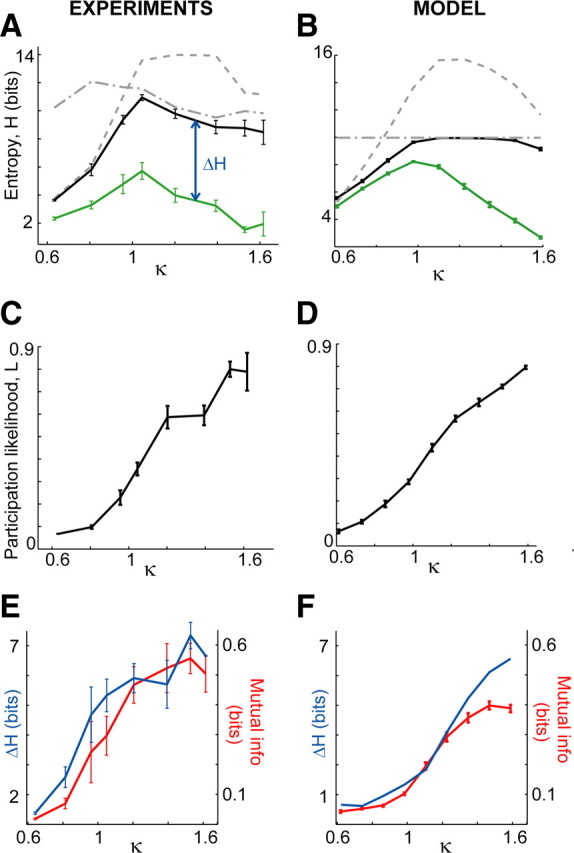
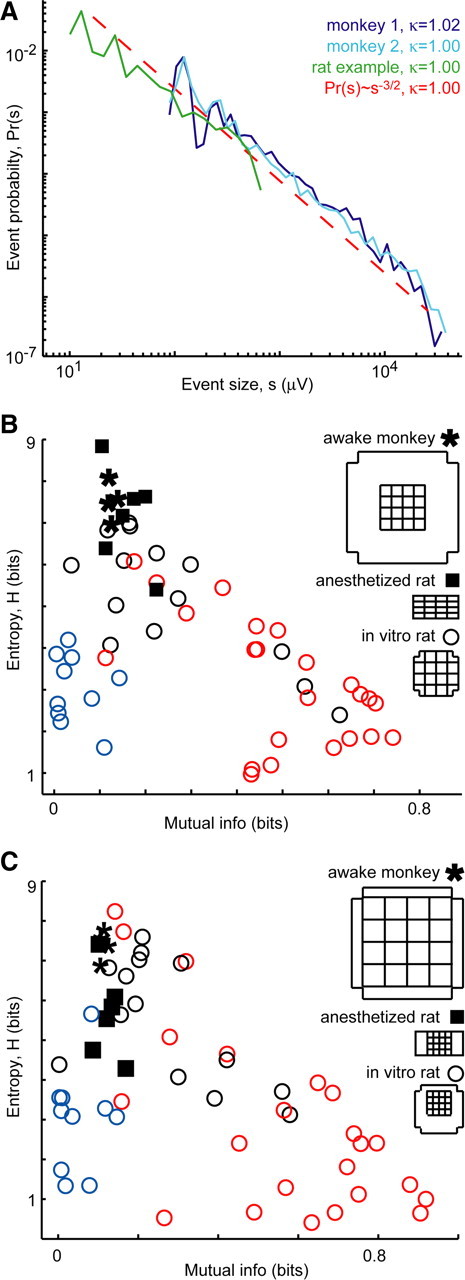
The repertoire of neural activity patterns that a cortical network can produce constrains the ability of the network to transfer and process information. Here, we measured activity patterns obtained from multisite local field potential recordings in cortex cultures, urethane-anesthetized rats, and awake macaque monkeys. First, we quantified the information capacity of the pattern repertoire of ongoing and stimulus-evoked activity using Shannon entropy. Next, we quantified the efficacy of information transmission between stimulus and response using mutual information. By systematically changing the ratio of excitation/inhibition (E/I) in vitro and in a network model, we discovered that both information capacity and information transmission are maximized at a particular intermediate E/I, at which ongoing activity emerges as neuronal avalanches. Next, we used our in vitro and model results to correctly predict in vivo information capacity and interactions between neuronal groups during ongoing activity. Close agreement between our experiments and model suggest that neuronal avalanches and peak information capacity arise because of criticality and are general properties of cortical networks with balanced E/I.


Figures

Figure 1.
Figure 1.
Measuring the neural activation pattern repertoire for a range of E/I conditions. A, Example LFP recordings under conditions of reduced E (left), unperturbed E/I (middle), and suppressed reduced I (right). Calibration: 250 ms, 10 μV (left, middle); 250 ms, 100 μV (right). Population events were defined based on large negative deflections (less than −4 SD; green). B, Top, Single examples of population events represented as binary patterns: 1, Active site; 0, inactive. Bottom, Rasters including 100 consecutive population events represented as binary patterns; each row represents one event, and each column represents one recording site. Left, Reduced E. Middle, Unperturbed. Right, Reduced I. C, Shape of event size distributions reveal changes in E/I, which are quantified with κ (see Materials and Methods; broken line, power law with exponent of −1.5).
Figure 2.
Figure 2.
Ongoing activity: peak information capacity at intermediate E/I ratio specified by κ ≈ 1. A, Information capacity (entropy H) of the pattern repertoire is maximized when no drugs perturb the E/I ratio. Significant differences are marked; *p < 0.05. Box plot lines indicate lower quartile, median, upper quartile; whiskers indicate range of data, excluding outliers (+, >1.5 times the interquartile range). B, The statistic κ provides a graded measure of E/I condition based on network dynamics (see Materials and Methods). C, Entropy H peaks near κ ≈ 1. Each point represents one recording of ongoing activity (n = 47; 8 × 8 MEA; 1 h; color indicates drug condition: red, PTX; blue, AP-5/DNQX; black, no drug). Line is the binned average of points. D, The peak in entropy H is robust to changes in spatial resolution (green; 4 × 4 coarse binned, 1 h), spatial extent (orange; 4 × 4 subregion, 1 h), and duration (purple; 4 × 4 coarse binned, 12 min) of recording (black, same data as in C). Error bars indicate mean ± SEM.
Figure 3.
Figure 3.
Stimulus-evoked activity: peak information transmission at intermediate E/I ratio specified by κ ≈ 1. A, Single shock stimuli with 10 different amplitudes (10–200 μA) were applied 40 times each using a single electrode. The pattern repertoire of stimulus-evoked activity has maximum entropy near κ = 1. This holds for 8 × 8 response patterns (black line) as well as coarse-resolution 4 × 4 patterns (green line). Points correspond to 8 × 8 patterns: light blue, AP-5/DNQX; gray, no drug; pink, PTX. B, The efficacy of information transfer, i.e., mutual information of stimulus and response, also peaks near κ = 1 (black, 8 × 8; green, 4 × 4). Error bars indicate SEM.
Figure 4.
Figure 4.
Peak information capacity explained. A detailed analysis of in vitro experimental results (left, Fig. 2D, green) and model results. A, B, Upper bounds on entropy are set by (1) the average likelihood that sites participate in patterns (dashed) and (2) the number of patterns observed (dash-dotted). When the effects of interactions are removed by shuffling (see Materials and Methods), the entropy reaches these bounds (black), but the measured entropy (green) is always lower as a result of interactions. C, D, Rise in participation likelihood L as E/I ratio is increased. This rise accounts for the bounds (dashed) shown in A and B. E, F, Rise in interactions between sites (mutual information, red) is proportional to the loss in information capacity ΔH (blue). All error bars indicate SEM.
Figure 5.
Figure 5.
In vivo properties predicted from in vitro results. A, Population event size distributions from ongoing activity in two awake monkeys (blue) and an example rat (green) are near a power law with exponent −1.5 (dashed line), i.e., they exhibit neuronal avalanches and κ ≈ 1. B, In line with in vitro and model predictions for κ ≈ 1, in vivo entropy was high and mutual information between recording sites was moderate (asterisks, 2 recordings on different days from each monkey; squares, anesthetized rats; n = 6). The spatial extent of recorded area was approximately matched. C, The result holds even when the spatial scales and resolution differ by factor of 4.

References

    1. Beggs JM, Plenz D. Neuronal avalanches in neocortical circuits. J Neurosci. 2003;23:11167–11177. - PMC - PubMed
    1. Churchland MM, Yu BM, Cunningham JP, Sugrue LP, Cohen MR, Corrado GS, Newsome WT, Clark AM, Hosseini P, Scott BB, Bradley DC, Smith MA, Kohn A, Movshon JA, Armstrong KM, Moore T, Chang SW, Snyder LH, Lisberger SG, Priebe NJ, Finn IM, Ferster D, Ryu SI, Santhanam G, Sahani M, Shenoy KV. Stimulus onset quenches neural variability: a widespread cortical phenomenon. Nat Neurosci. 2010;13:369–378. - PMC - PubMed
    1. Dan Y, Atick JJ, Reid RC. Efficient coding of natural scenes in the lateral geniculate nucleus: experimental test of a computational theory. J Neurosci. 1996;16:3351–3362. - PMC - PubMed
    1. Dayan P, Abbott LF. Theoretical neuroscience. Cambridge, MA: Massachusetts Institute of Technology; 2001.
    1. Dichter MA, Ayala GF. Cellular mechanisms of epilepsy: a status report. Science. 1987;237:157–164. - PubMed

Publication types

MeSH terms