. 2011 Jan 5;31(1):78-88.
doi: 10.1523/JNEUROSCI.3542-10.2011.

Contexts for dopamine specification by calcium spike activity in the CNS

Affiliations

Contexts for dopamine specification by calcium spike activity in the CNS

Norma A Velázquez-Ulloa et al. J Neurosci. .

Abstract

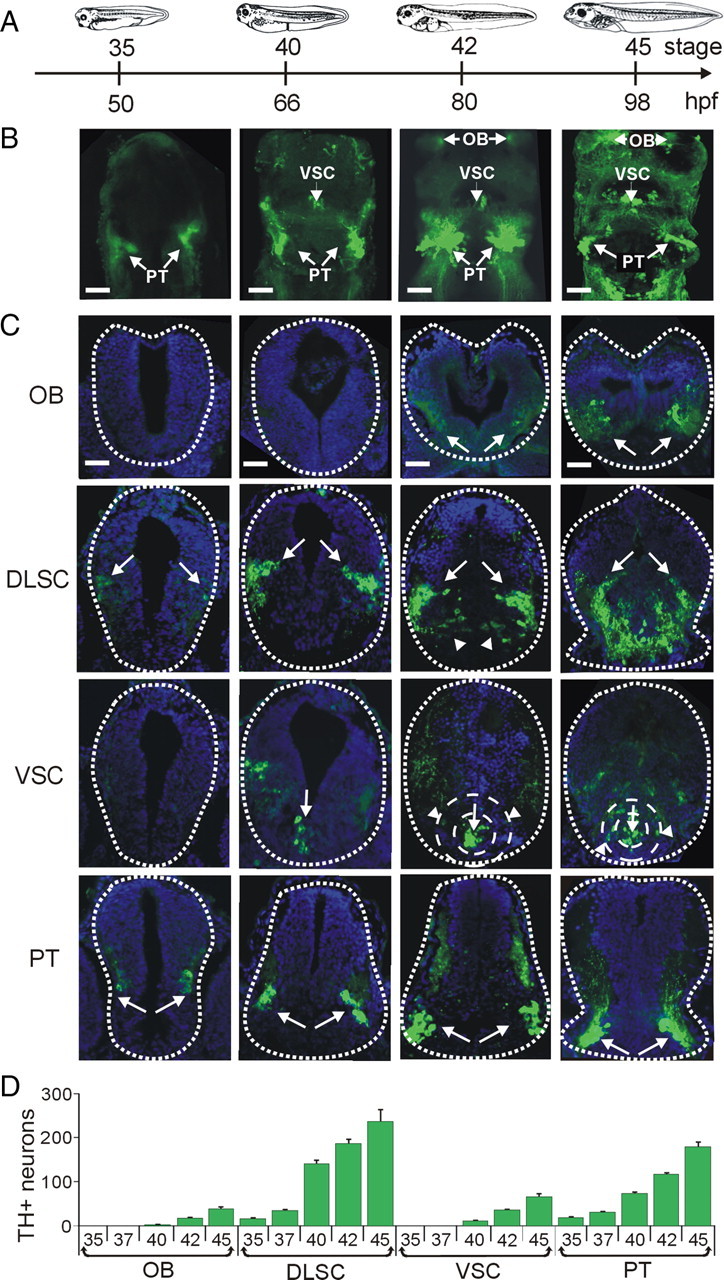
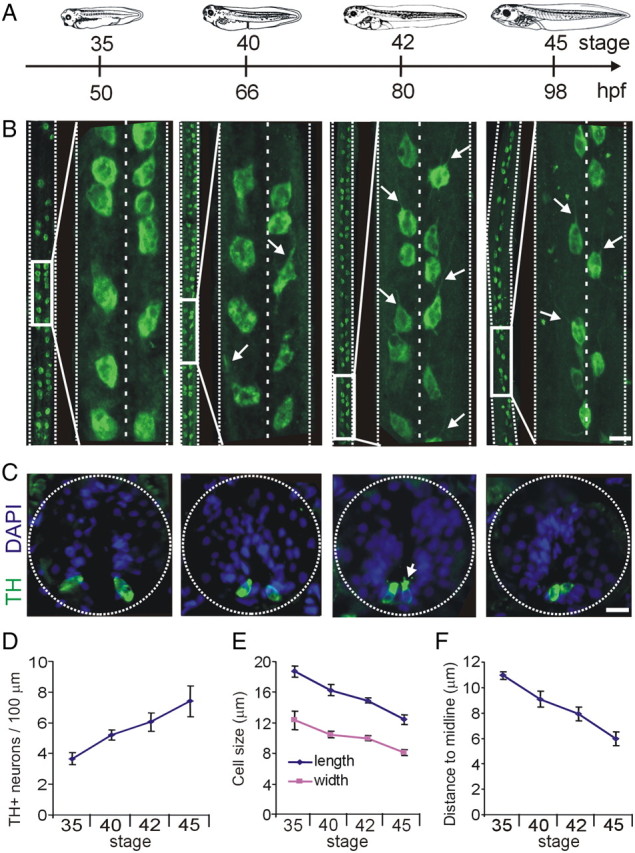
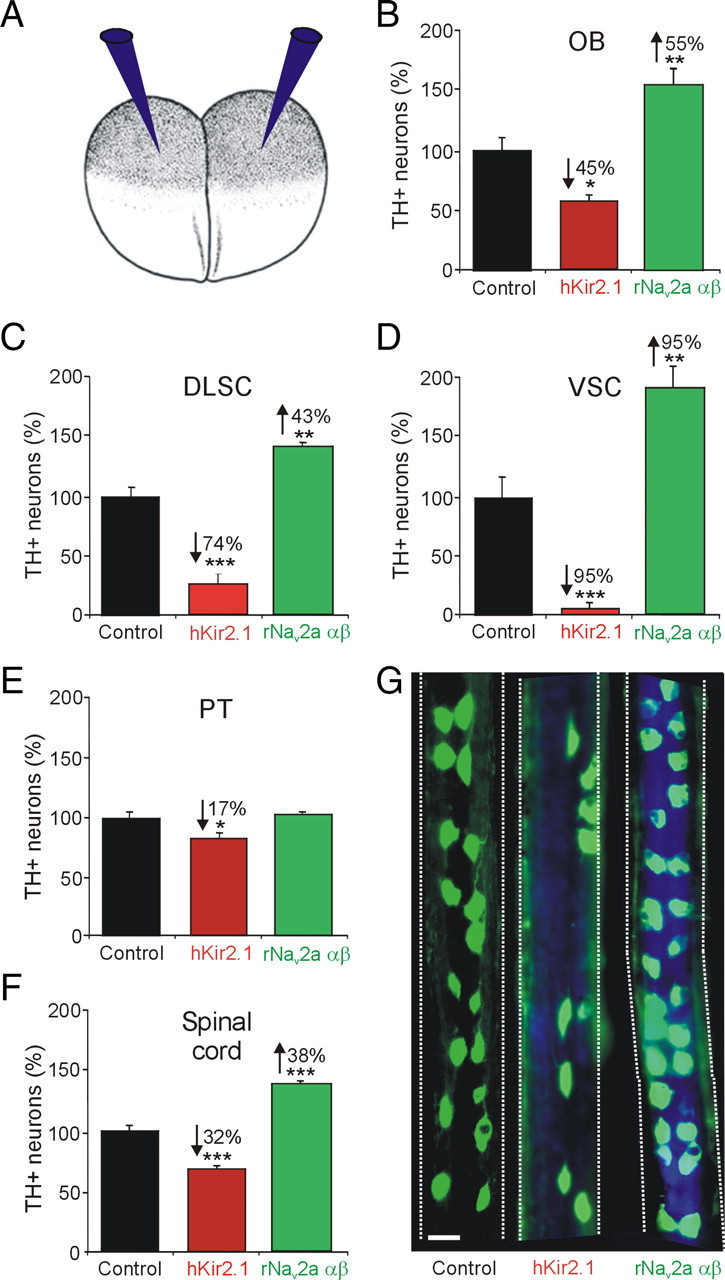
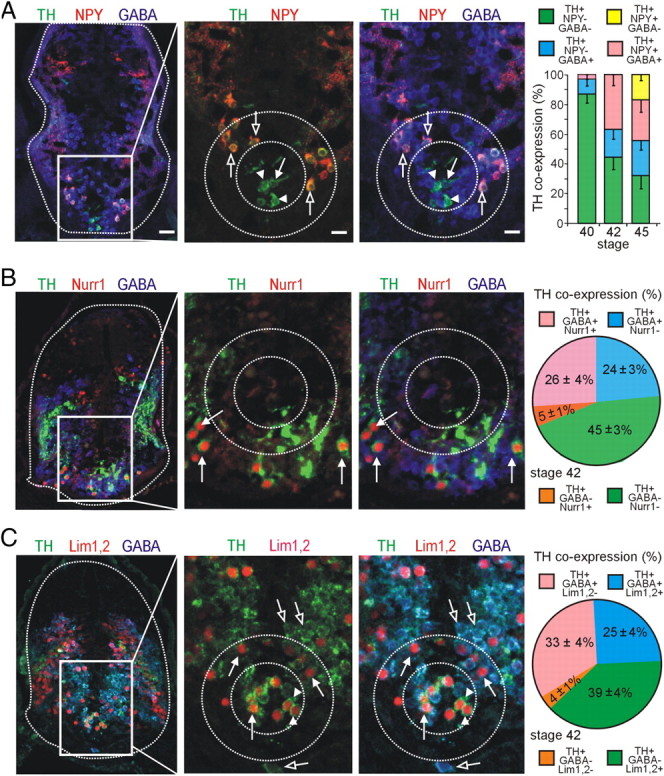
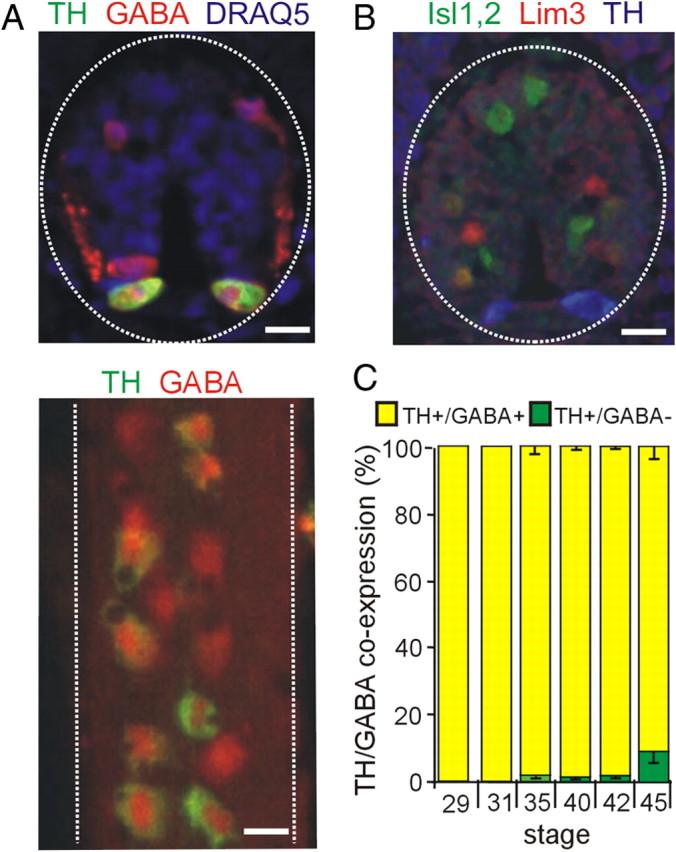
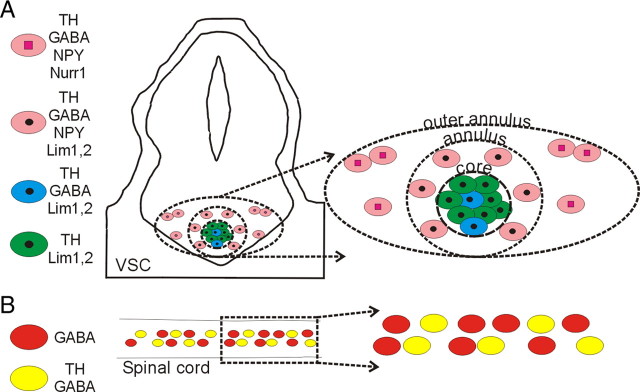
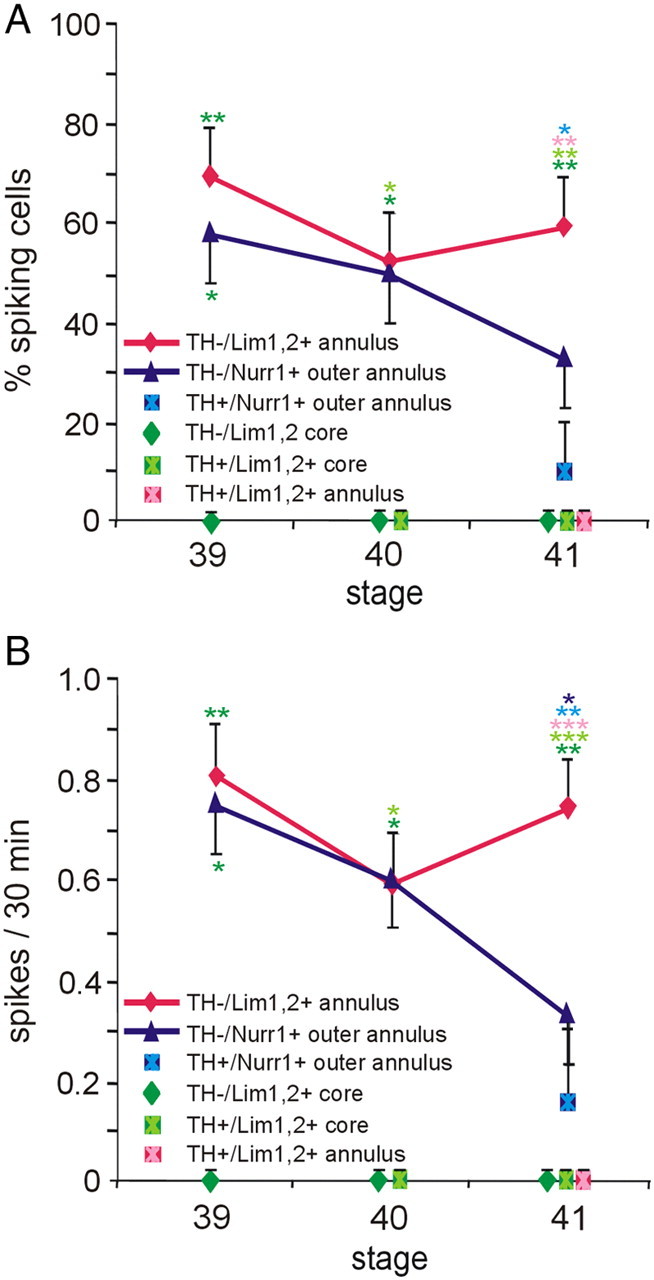
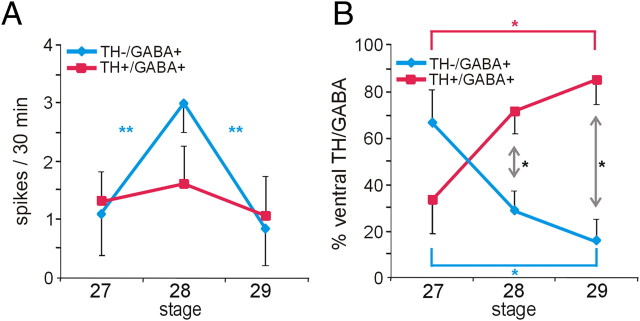
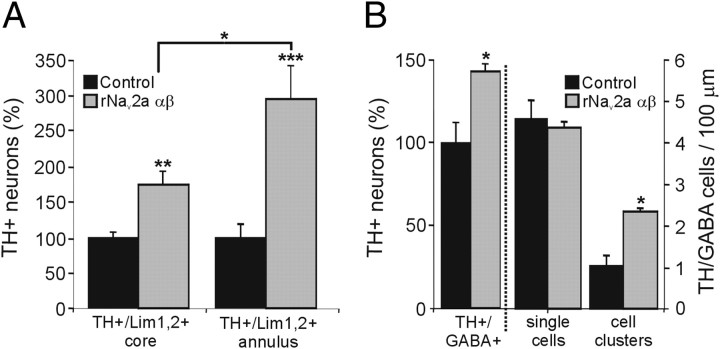
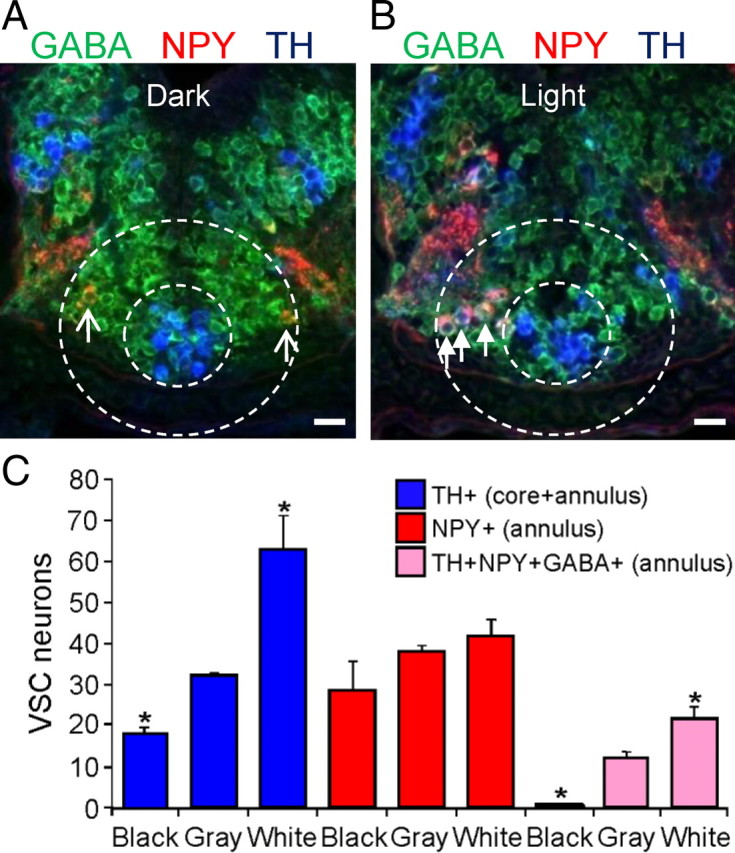
Calcium-dependent electrical activity plays a significant role in neurotransmitter specification at early stages of development. To test the hypothesis that activity-dependent differentiation depends on molecular context, we investigated the development of dopaminergic neurons in the CNS of larval Xenopus laevis. We find that different dopaminergic nuclei respond to manipulation of this early electrical activity by ion channel misexpression with different increases and decreases in numbers of dopaminergic neurons. Focusing on the ventral suprachiasmatic nucleus and the spinal cord to gain insight into these differences, we identify distinct subpopulations of neurons that express characteristic combinations of GABA and neuropeptide Y as cotransmitters and Lim1,2 and Nurr1 transcription factors. We demonstrate that the developmental state of neurons identified by their spatial location and expression of these molecular markers is correlated with characteristic spontaneous calcium spike activity. Different subpopulations of dopaminergic neurons respond differently to manipulation of this early electrical activity. Moreover, retinohypothalamic circuit activation of the ventral suprachiasmatic nucleus recruits expression of dopamine selectively in reserve pool neurons that already express GABA and neuropeptide Y. The results are consistent with the hypothesis that spontaneously active neurons expressing GABA are most susceptible to activity-dependent expression of dopamine in both the spinal cord and brain. Because loss of dopaminergic neurons plays a role in neurological disorders such as Parkinson's disease, understanding how subpopulations of neurons become dopaminergic may lead to protocols for differentiation of neurons in vitro to replace those that have been lost in vivo.


Figures

Figure 1.
Figure 1.
Development of brain dopaminergic nuclei. A, Developmental timeline showing stages and corresponding hours postfertilization (hpf) at which larvae were fixed for the images shown above. B, Whole-mount projections of brains stained for TH show caudal-to-rostral appearance of dopaminergic nuclei. Images are ventral side and rostral end up. The PT nucleus is visible from stage 35; by stage 40, the VSC can be detected; and by stage 42, the OB is also present. C, Cross sections through the brain were used for quantification of TH+ cells. TH staining is shown in green and DAPI staining of cell nuclei is shown in blue. Arrows point to TH+ cells in each section. The first row shows the OB, and the second row shows the DLSC. Arrowheads in this row point to a medial branch of the DLSC that becomes more prominent during development. The third row depicts the VSC. The arrows point to the core and the arrowheads point to TH+ cells in the annular region of the VSC, present from stage 42. The fourth row shows the PT nuclei. D, Quantification of the number of TH+ neurons per nucleus during development. Scale bars, 50 μm. Values are mean ± SEM for n ≥ 6 larvae per stage.
Figure 2.
Figure 2.
Development of spinal cord dopaminergic neurons. A, Developmental timeline as in Figure 1. B, Whole-mount projections of spinal cords stained for TH immunoreactivity. At each stage, large midbody segments of spinal cord are shown on the left side, and an inset expansion is shown on the right. Projections are shown ventral side and rostral end up. Arrows on the stages 40, 42, and 45 panels point to axons extending rostrally. C, Cross sections through the spinal cord at different stages of development. Dopaminergic spinal neurons are located on the ventral side of the spinal cord. The arrow points to microvilli and cilia extending into the central canal. D, Quantification of the number of neurons per 100 μm of spinal cord at different stages of development. E, Length and width measurements of dopaminergic spinal neurons. F, Quantification of the distance to the midline. Scale bars, 15 μm. Values are mean ± SEM for n ≥ 4 larvae per stage.
Figure 3.
Figure 3.
Dopaminergic specification is activity dependent. A, Embryos at the two-cell stage were injected bilaterally with either hKir2.1 or rNav2a αβ mRNA along with Cascade Blue tracer, to decrease or increase calcium spike activity, respectively (Borodinsky et al., 2004; Dulcis and Spitzer, 2008). B–F, Number of TH+ neurons (percentage) in activity-manipulated embryos in the OB (B), DLSC (C), VSC (D), PT (E), and spinal cord (F). G, Spinal cord whole mounts from stage 42 larvae stained for TH immunoreactivity (in green) show the effect of channel misexpression. The tracer (in blue) is seen in spinal cords from activity-manipulated larvae. Numerical percentage change is indicated in cases of significant difference (n ≥ 6 larvae per stage; values are mean ± SEM): *p < 0.05, **p < 0.01, ***p < 0.001, comparing control values with hKir2.1 or rNav2a αβ. The Mann–Whitney U test was used to assess statistical significance. Scale bar, 25 μm.
Figure 4.
Figure 4.
Coexpression of TH with other molecular markers during development of the VSC. GABA, NPY, or GABA/NPY are coexpressed in distinct regions of the VSC during development. A, Some TH+ cells in the core region (inner dashed circle) coexpress GABA (arrow), whereas others are GABA (arrowheads). TH+ neurons in the annular region are TH+/GABA+/NPY+ (outer dashed circle, open arrows). Graph shows developmental changes in proportions of GABA and NPY coexpression with TH. B, TH+ cells of the outer annular region coexpress GABA and Nurr1 (arrows). This brain section depicts a more caudal region of the VSC. Graph shows the proportion of TH coexpression with GABA and Nurr1. C, TH+ cells of the core all coexpress Lim1,2 (arrowheads), but some are also GABA+ (arrows), whereas the TH+ cells in the annulus coexpress Lim1,2 and GABA (arrows). Cells in the outer annular region are Lim1,2 but coexpress TH and GABA (open arrows). Graph shows the proportion of TH coexpression with GABA and Lim1,2. A–C, Images are from stage 42 larvae. Scale bars (in A apply to all figures in each column): column 1, 80 μm; columns 2, 3, 40 μm. Values are mean ± SEM for n ≥ 4 larvae per stage.
Figure 5.
Figure 5.
Coexpression of TH with GABA during development of the spinal cord. A, Top, Cross section through a stage 35 spinal cord shows coexpression of GABA in ventrally located dopaminergic cells. Dorsal GABAergic interneurons are also evident. Ventral side is down. Bottom, Whole mount of the spinal cord shows dopaminergic neurons within the rows of GABAergic ventral neurons in a stage 42 spinal cord. Ventral side is shown. B, TH does not colocalize with Lim3 or Isl1,2; stage 35 spinal cord. C, Percentage coexpression of TH and GABA during development. Scale bars, 15 μm. Values are mean ± SEM for n ≥ 4 late tail-bud embryos or larvae per stage.
Figure 6.
Figure 6.
Subclasses of VSC and spinal cord dopaminergic neurons. The VSC is composed of four subclasses of dopaminergic neurons that can be identified by their coexpression of Lim1,2 or Nurr1 transcription factors and NPY and GABA neurotransmitters at stage 42. Spinal cord dopaminergic neurons constitute a single class at this stage. Panels on the right show expanded views of regions at the left.
Figure 7.
Figure 7.
Spontaneous calcium spike activity in the VSC during TH acquisition. A, The incidence of spiking is different in VSC neurons expressing distinct molecular markers or located in different regions. Spikes were not detected in Lim1,2+ core and TH+/Lim1,2+ core neurons at stages 39–41, whereas spikes were initially observed in TH/Lim1,2+ and TH/Nurr1+ annular and outer annular neurons. At stage 41, spikes were not observed in annular TH+/Lim1,2+ neurons although still recorded in some TH+/Nurr1+ outer annular neurons. B, The frequency of spiking is also different. TH/Lim1,2+ and TH/Nurr1+ annular and outer annular neurons initially have a similar frequency of spiking that diverges during development. By stage 41, annular TH+/Nurr1+ cells spike at a relatively low frequency, annular TH/ Lim1,2+ cells spike at a relatively high frequency, and spikes were not observed in TH+/Lim1,2+ annular cells. n ≥ 4 brain sections per stage with n ≥ 4 neurons per class across brain sections; values are mean ± SEM. Significant differences between cell types are indicated: *p < 0.05, **p < 0.01, ***p < 0.001, color coded according to the figure labels comparing across DA subtypes and across stages. The Kruskal–Wallis test followed by Conover's post hoc analysis was used to determine statistical significance.
Figure 8.
Figure 8.
Spontaneous calcium spike activity and neurotransmitter expression in the spinal cord during TH acquisition. A, The incidence of calcium spiking is constant in spinal cord neurons at stages 27–29 (data not shown), but the frequency varies during this period: TH+/GABA+ neurons display a low and constant frequency of calcium spikes, whereas the TH/GABA+ population shows an increase in frequency at stage 28 that decreases again by stage 29. **p < 0.01, comparing across stages; the Kruskal–Wallis test followed by Conover's post hoc analysis was used to determine statistical significance. B, The proportion of cells within the GABA-immunoreactive population of the ventral spinal cord that are TH/GABA+ and TH+/GABA+ changes during development, with the first group decreasing and the second increasing between stages 27, 28, and 29/30. Significant differences between the TH/GABA+ and TH+/GABA+ populations by stage (black asterisks; *p < 0.05 assessed by the Mann–Whitney U test) and across developmental stages for each cell population (colored asterisks; *p < 0.05 assessed by the Kruskal–Wallis test followed by Conover's post hoc analysis) are indicated. n ≥ 4 neural tubes with n ≥ 7 TH/GABA+ or TH+/GABA+ neurons per neural tube per stage; values are mean ± SEM.
Figure 9.
Figure 9.
Neurotransmitter expansion in the VSC and spinal cord of activity-manipulated larvae. A, The number of TH neurons in the VSC core and annulus increases upon overexpression of rNav2a αβ. Expansion of the TH phenotype occurs within the Lim1,2 population in both core and annulus (**p < 0.01, ***p < 0.001, compared with control by the Mann–Whitney U test), and the expansion in the annulus is significantly greater than the expansion in the core (*p < 0.05, comparing normalized control with rNav2a αβ values for the core and annulus with the Kruskal–Wallis test followed by the Conover's post hoc analysis). Stage 42; values are mean ± SEM for n = 6 embryos. B, rNav2a αβ overexpression expands the TH phenotype within the ventral GABA+ population of the spinal cord (*p < 0.05, comparing control vs rNav2a αβ values by the Mann–Whitney U test), increasing the number of clusters of TH+/GABA+ cells (*p < 0.05, comparing control vs rNav2a αβ values by the Mann–Whitney U test). Stage 35; values are mean ± SEM for n ≥ 4 larvae.
Figure 10.
Figure 10.
TH specification of NPY+/GABA+ VSC annular neurons after light adaptation. A, The VSC of a larva dark adapted on a black background for 2 h and triple stained for TH, NPY, and GABA is shown in a merged image of a transverse section. Arrows indicate TH/NPY+/GABA+ neurons before induction of TH. B, The VSC of a larva light adapted on a white background for 2 h and triple stained for TH, NPY, and GABA in a merged image. Arrows indicate TH+/NPY+/GABA+ neurons after TH induction. A, B, Stage 42. Scale bars, 30 μm. C, Quantification of the number of neurons in the VSC that express TH, NPY, or TH+/NPY+/GABA+. Exposure to light increases and dark decreases the number of TH+ neurons recruited from the NPY+/GABA+ annular pool. n = 6 larvae; values are mean ± SEM. *p < 0.05 comparing light or dark conditions with low illumination on a gray background using the Mann–Whitney U test.

References

    1. Abalo XM, Villar-Cheda B, Anadón R, Rodicio MC. Development of the dopamine-immunoreactive system in the central nervous system of the sea lamprey. Brain Res Bull. 2005;66:560–564. - PubMed
    1. Abbott LC, Isaacs KR, Heckroth JA. Co-localization of tyrosine hydroxylase and zebrin II immunoreactivities in Purkinje cells of the mutant mice, tottering and tottering/leaner. Neuroscience. 1996;71:461–475. - PubMed
    1. Ang SL. Transcriptional control of midbrain dopaminergic neuron development. Development. 2006;133:3499–3506. - PubMed
    1. Appel B, Korzh V, Glasgow E, Thor S, Edlund T, Dawid IB, Eisen JS. Motoneuron fate specification revealed by patterened LIM homeobox gene expression in embryonic zebrafish. Development. 1995;121:4117–4125. - PubMed
    1. Austin MC, Schultzberg M, Abbott LC, Montpied P, Evers JR, Paul SM, Crawley JN. Expression of tyrosine hydroxylase in cerebellar Purkinje neurons of the mutant tottering and leaner mouse. Mol Brain Res. 1992;15:227–240. - PubMed

Publication types

MeSH terms

LinkOut - more resources