. 2011 Jan 5;31(1):300-13.
doi: 10.1523/JNEUROSCI.4055-10.2011.

The neuronal basis of long-term sensorimotor learning

Affiliations

The neuronal basis of long-term sensorimotor learning

Yael Mandelblat-Cerf et al. J Neurosci. .

Abstract

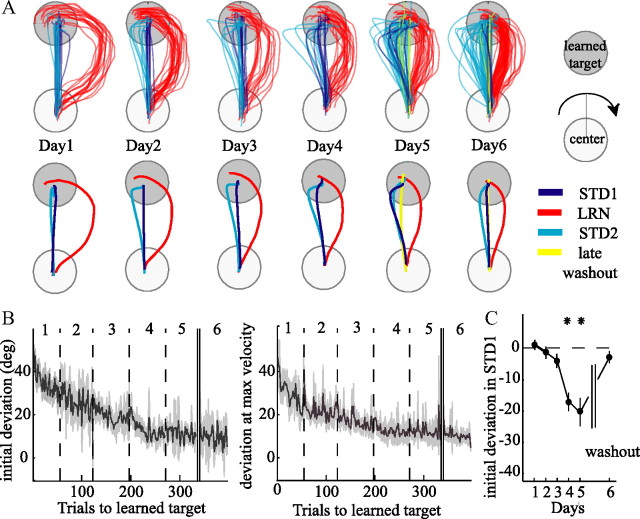
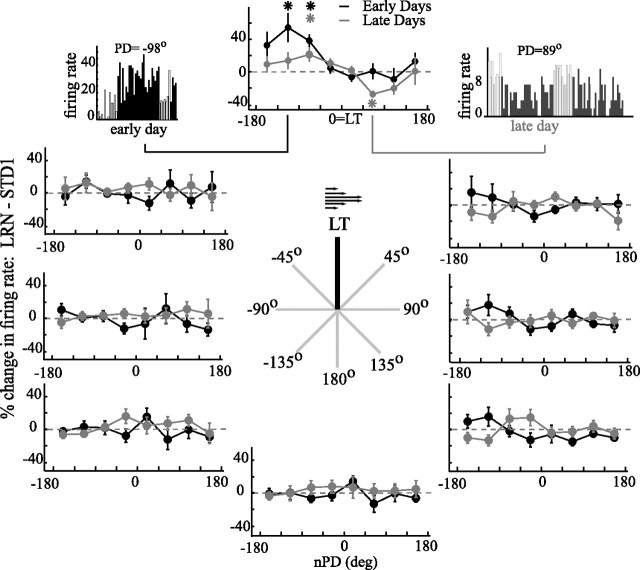
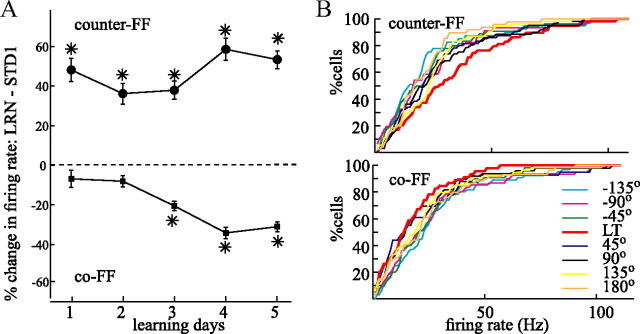
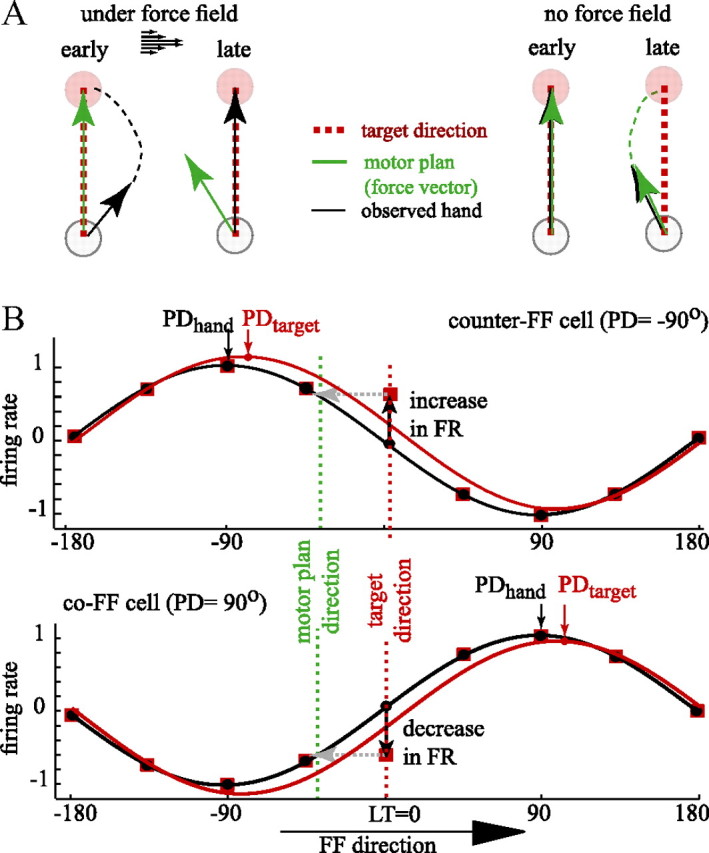
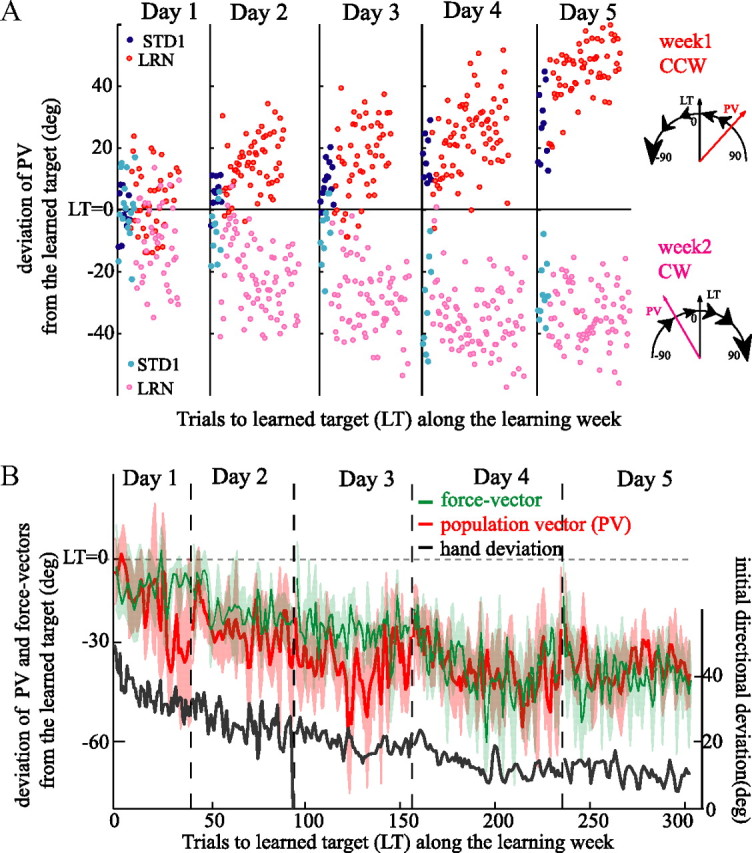
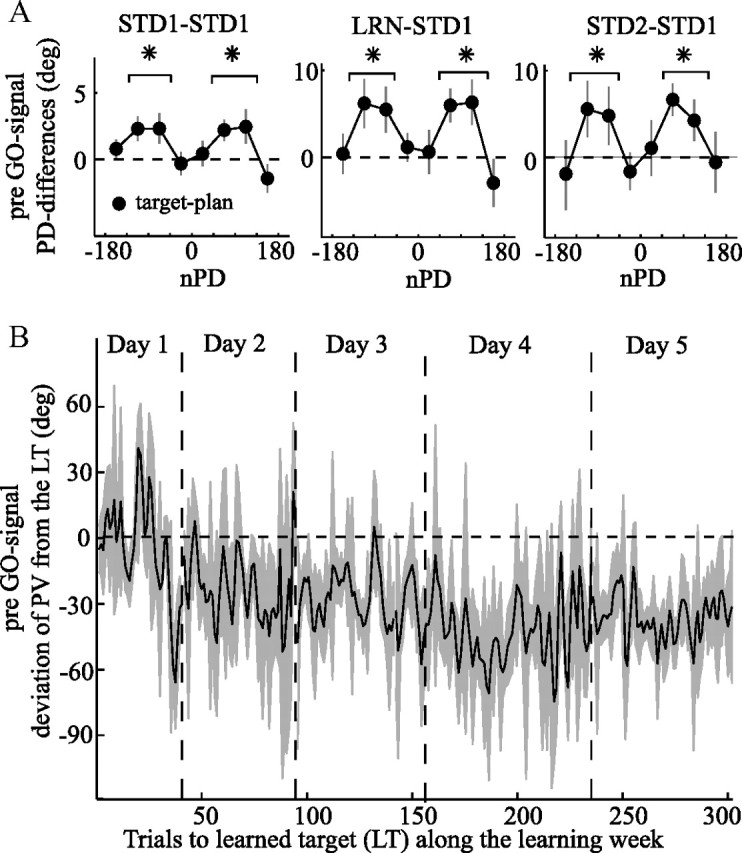
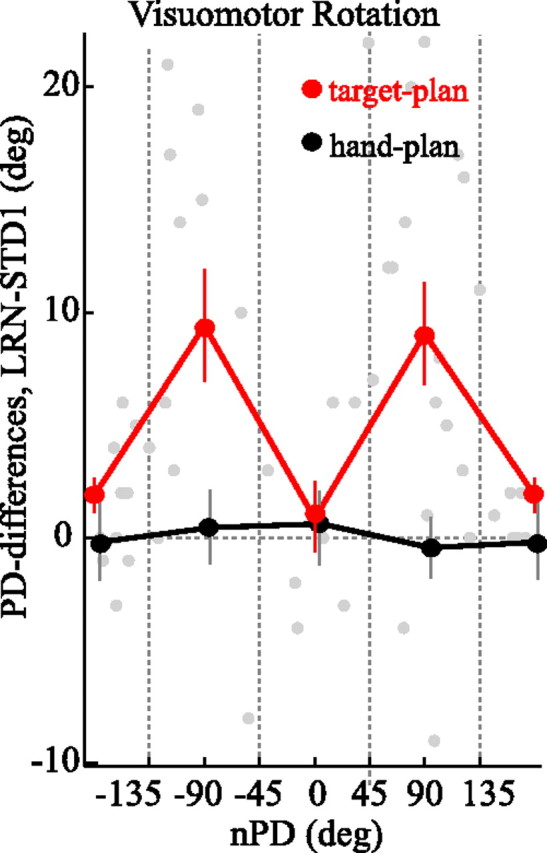
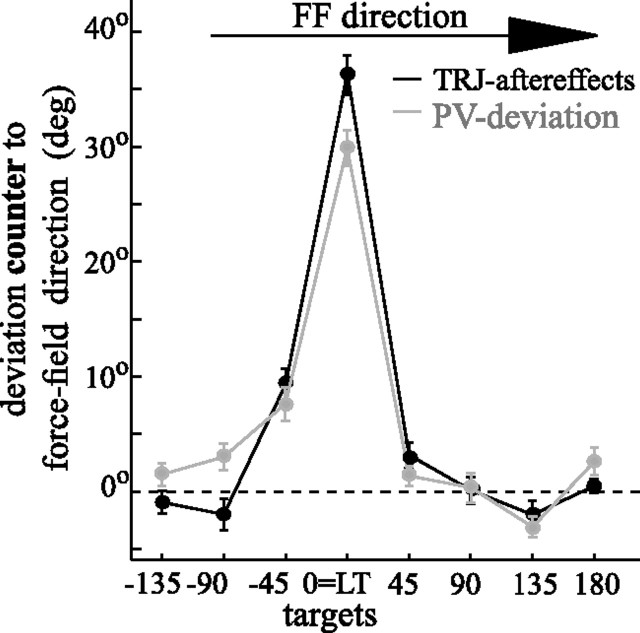
The brain has a remarkable ability to learn and adjust behavior. For instance, the brain can adjust muscle activation to cope with changes in the environment. However, the neuronal mechanisms behind this adaptation are not clear. To address this fundamental question, this study examines the neuronal basis of long-term sensorimotor learning by recording neuronal activity in the primary motor cortex of monkeys during a long-term adaptation to a force-field perturbation. For 5 consecutive days, the same perturbation was applied to the monkey's hand when reaching to a single target, whereas movements to all other targets were not perturbed. The gradual improvement in performance over these 5 days was correlated to the evolvement in the population neuronal signal, with two timescales of changes in single-cell activity. Specifically, one subgroup of cells showed a relatively fast increase in activity, whereas the other showed a gradual, slower decrease. These adapted patterns of neuronal activity did not involve changes in directional tuning of single cells, suggesting that adaptation was the result of adjustments of the required motor plan by a population of neurons rather than changes in single-cell properties. Furthermore, generalization was mostly expressed in the direction of the required compensatory force during adaptation. Altogether, the neuronal activity and its generalization accord with the adapted motor plan.


Figures

Figure 1.
Figure 1.
Experimental design. A, Example of a trial flow (left to right) during the learning epoch. During the first delay period, the monkey held the robotic arm in the center without moving it. The monkeys maintained their hold at the central circle after target onset for an additional delay and only moved after the go signal. In the figure, the learned target is at 0° and the force-field is clockwise. In the rightmost panels, if the lit target was the selected learned target (bottom row), force-field was applied when movement was initiated, otherwise (top row) the movement was executed under standard conditions. B, Recording day flow: all days started with standard trials (center-out reaching movements to 8 directions) followed by a learning epoch. In days 1–4, this was followed by a second standard period and then ended with a second learning period. Days 5 and 6 consisted of three different periods only. Learning was followed by a long standard epoch (WASHOUT).
Figure 2.
Figure 2.
Movement kinematics to the learned target during standard and perturbed trials reflects gradual learning. A, Example of trajectories to the learned target in all epochs (top row) and their averages (bottom row) during the 6 learning days (left to right). Movements under force-field are in red. Movements without force-field are in dark blue for STD1, cyan for STD2, and yellow for late in washout. B, Gradual behavioral improvement during learning and its retention. The figure shows angular deviations at movement initiation (left) and at maximum velocity (right) with a five-trial moving average as a function of trial number to the learned target along the learning week (5 d and hundreds of trials). Data include 7 weeks (5 weeks from monkey R and 2 weeks from monkey O). C, Averaged initial angular deviations across all movements to the learned target during STD1 epoch. Significant overnight aftereffects are evident on days 4 and 5. Washout on day 5 (2 black lines) resulted in small overnight aftereffects on day 6. In all traces, error bars and shaded areas denote SEM. Asterisks denote 1% confidence.
Figure 3.
Figure 3.
Changes in movement-related firing rates are only evident in movements to the learned target (LT), dependent on the preferred directions of the cells and on the learning stage. The figure shows the averaged percentage of daily changes of firing rates between standard and learning epochs, as a function of the nPDs of cells in bins in a range of 45°. Analysis was done separately for movements to each of the eight targets around the learned target. Data are divided into early (black) and late (gray) days of learning. Note that cells with nPDs around −90° from the LT (counter-FF cells) increased their activity mostly early in learning, whereas cells with nPDs around +90° from the LT (co-FF cells) showed some decrease late in learning. Insets provide examples of firing rates (blank bars, standard trials; full bars, learning trials), for two single cells: a cell with PD counter to force-field direction early in learning showed increased activity (left), and a cell with PD with force-field direction late in learning showed decreased activity (right). In all traces, asterisks denote 1% confidence, and error bars denote SEM. n = 346 in early days and n = 264 in late days.
Figure 4.
Figure 4.
Dynamics of evolving learning-related activity during perturbations depend on the PD of the cell. A, Percentage of change in the averaged firing rates across cells with PDs in the range −135° < nPD < −45° (counter-FF, top) and the range 45° < nPD < 135° (co-FF, bottom) compared with the averaged firing rate of cells with PDs in the same range during prelearning standard trials of day 1. The plot shows that counter-FF cells significantly increase their activity in day 1 and maintain the elevated activity throughout learning, whereas co-FF cells show a significant decrease but only on day 3. Asterisks denote 1% confidence, and error bars denote SEM. B, The cumulative distributions of firing rates to the learned target (LT) late in learning (thick red line) for counter-FF (left) and co-FF (right) cells. For each of the nonlearned targets (different colors, excluding the thick red line), the plots show the cumulative distribution of the firing rates of the population of cells with nPDs located in a counter-FF (left) or co-FF (right) direction relative to each target. Note that all curves lie above (left) or below (right) the red curve, which marks the respective cumulative distributions of the counter- and co-FF activities in movements to the learned target. n = 264.
Figure 5.
Figure 5.
Directional tuning of cells under perturbation depends on the selected reference frame: schematics. A, Schematic chart directions of the learned target (red), the observed hand (black), and the force-vector applied by the hand (green) for early and late stages of learning. The scheme shows, during adaptation to the perturbing force-field (left), the observed hand direction gradually points to the target, whereas the motor plan becomes deviated in the opposite direction. When the force-field is removed (right), the observed hand direction always follows the new motor plan. Therefore, early in learning, it points to the target, and, later, it points counter to the force-field direction. B, A model of PD computation. Black curves are the directional tuning of counter-FF (up) and co-FF (down) cells. A new cosine fit for the counter-FF (or co-FF) cell with increased (or decreased) activity for the LT results in red curves, which are shifted with force-field direction. FR, Firing rate. Dotted green lines denote the direction of a motor plan that can produce such changes in activity.
Figure 6.
Figure 6.
Directional tuning of cells under perturbation depends on the selected reference frame: neuronal data. The x-axis in all plots is the nPD of the cells, in bins of 45°, with learned target at 0. The y-axis in A–C shows differences between PDs late in learning. The title of each plot shows the compared epochs. A, The PD differences between learning and STD1 are positive, showing apparent shifts with force-field direction. The plots show that the differences depend on (1) the nPD of the cell and (2) the reference frame during learning [PDtarget (red), PDhand (black), or PDplan (green)]. B, PDtarget (red), but not PDhand and PDplan (black–green), show in STD2 apparent shifts relative to STD1 with force-field direction in a similar pattern as in learning (A). C, Comparing PDtarget and PDplan in STD1 (red) reveals a similar pattern of apparent PD shifts. Note that the comparison was made between the same cells with the same activity for the same trials and differed only by the reference frame. n = 264. In all traces, error bars denote SEM. Large and small asterisks denote 1 and 5% confidence, respectively.
Figure 7.
Figure 7.
Control analyses for the relation between directional tuning, selected reference frames, and adaptation. A, The relation between apparent shifts and discrepancy between hand and target directions is demonstrated by separating STD1 trials to the learned target to those with large (gray) and small (black) overnight aftereffects. B, The observed (obs) firing rate during learning matches the expected (exp) activity from movements in the force-vector direction (black) and the observed activity when perturbation is removed (gray). n = 264. In all traces, error bars denote SEM.
Figure 8.
Figure 8.
Apparent PD shifts are reversed during washout and recommence during relearning; this effect is seen only in counter-FF cells, reflecting only the fast process. The analysis shows day 5 (left) and day 6 (right). The y-axes show differences in PDs between reference frames, as a function of the nPD of the cell. The solid black lines show comparisons of the PDplan in STD1 to PDtarget in STD1 (A), learning (B), and late in washout (C). The differences between PDtarget late in washout and PDtarget in learning are shown as gray lines. n = 130 on day 5 and n = 126 on day 6. In all traces, asterisks show 1% confidence, and error bars denote SEM. Square brackets indicate that significance was calculated on cells from two adjacent bins together, in a total range of 90°.
Figure 9.
Figure 9.
Adaptation of the population-vectors (PVs). The PVs during movements to the learned target (LT) gradually deviate in a direction against the force-field, with the force-vector direction. A, Population-vector estimations for single trials to learned target (dots) during 2 learning weeks that had the same learned target (at 0°) but opposing force-fields. STD1 trials are denoted in blue (week 1) and cyan (week 2) and learning trials in red (week 1) and magenta (week 2). The opposing force-fields induced opposing deviations of population-vectors from the learned target, each against its force-field direction. Note that, on days 4 and 5, population-vectors in STD1 are deviated and coincide with the overnight aftereffects that are described in Figure 2C. CW, Clockwise; CCW, counterclockwise. B, Population-vectors (red) and force-vectors (green) averaged over 7 weeks show a gradual and similar deviation from the learned target, counter to force-field direction. The average learning curve (copied from Fig. 2B) is shown (black line) with its y-axis on the right, for comparison of temporal evolvement. Note that, when the population-vectors and force-vector point to the learned target (early in learning), the hand (black) deviates away from it. n = 704. Shaded areas denote SEM.
Figure 10.
Figure 10.
The neuronal changes are apparent before movement onset. A, The figure depicts PD differences computed for neuronal activity before the go signal (late learning days). The comparisons of PDplan in STD1 to PDtarget in STD1 (left), LRN (middle), and STD2 (right) show the double-peak pattern of apparent PD shifts in all three cases. Asterisks denote 1% confidence, and square brackets indicate that significance was calculated on cells from two adjacent bins together, in a total range of 90°. B, Population-vectors (PV) estimated for activity before the go signal, averaged over 7 weeks, show a gradual deviation from the LT counter to force-field direction. n = 486. Shaded areas and error bars denote SEM.
Figure 11.
Figure 11.
PDtarget, and not PDhand, show apparent PD shifts in a kinematic task (visuomotor rotation). Gray dots indicate the differences for single cells between PDtarget in the learning epoch compared with the PD in standard epoch. The red line indicates the averaged PD differences across cells, binned in 90°. For purposes of illustration, the average of subgroup with |PD| >135 is depicted twice at both ends of the x-axis. Comparing PD in standard with PDhand in learning (black) did not show any systematic differences. n = 52. Error bars denote SEM.
Figure 12.
Figure 12.
Generalization of local adaptation to force-field is affected by the motor plan. Generalization is measured by initial directional deviations of trajectories (TRJ-aftereffects, black line) and the corresponding population-vectors (PV-deviation, gray line). Note that trajectories aftereffects to the learned target were only measured in STD2 after the first epoch of learning trials, but all other directions were measured during learning. The figure shows the trajectories aftereffects and population-vector deviations from each of the targets around the learned target, taken at late stages of adaptation. Note the elevated effect to target −45°. n = 264. Error bars denote SEM.

References

    1. Arce F, Novick I, Shahar M, Link Y, Ghez C, Vaadia E. Differences in context and feedback result in different trajectories and adaptation strategies in reaching. PLoS One. 2009;4:e4214. - PMC - PubMed
    1. Arce F, Novick I, Mandelblat-Cerf Y, Israel Z, Ghez C, Vaadia E. Combined adaptiveness of specific motor-cortical ensembles underlies learning. J Neurosci. 2010a;30:5415–5425. - PMC - PubMed
    1. Arce F, Novick I, Mandelblat-Cerf Y, Vaadia E. Neuronal correlates of memory formation in motor cortex after adaptation to force field. J Neurosci. 2010b;30:9189–9198. - PMC - PubMed
    1. Burdet E, Osu R, Franklin DW, Milner TE, Kawato M. The central nervous system stabilizes unstable dynamics by learning optimal impedance. Nature. 2001;414:446–449. - PubMed
    1. Caithness G, Osu R, Bays P, Chase H, Klassen J, Kawato M, Wolpert DM, Flanagan JR. Failure to consolidate the consolidation theory of learning for sensorimotor adaptation tasks. J Neurosci. 2004;24:8662–8671. - PMC - PubMed

Publication types

LinkOut - more resources