. 2011 Jan 5;31(1):359-70.
doi: 10.1523/JNEUROSCI.2225-10.2011.

The mitochondrial permeability transition pore regulates nitric oxide-mediated apoptosis of neurons induced by target deprivation

Affiliations

The mitochondrial permeability transition pore regulates nitric oxide-mediated apoptosis of neurons induced by target deprivation

Lee J Martin et al. J Neurosci. .

Abstract

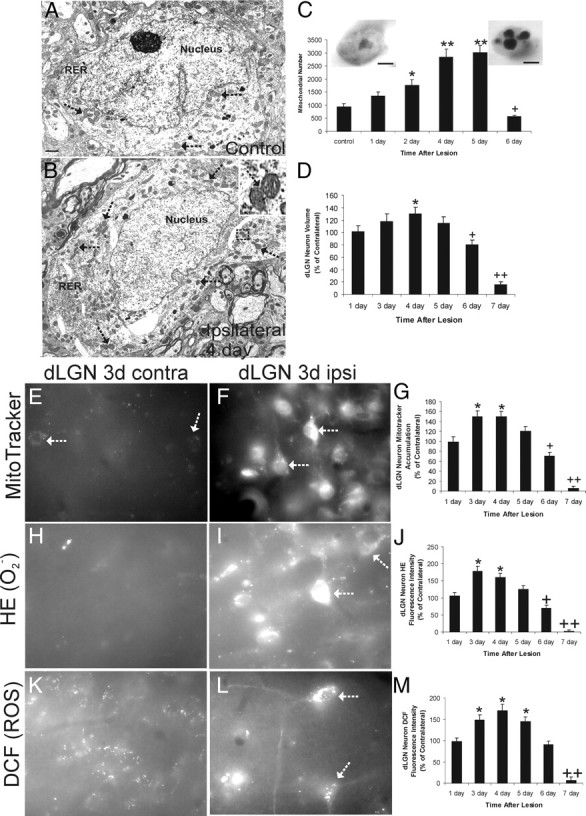
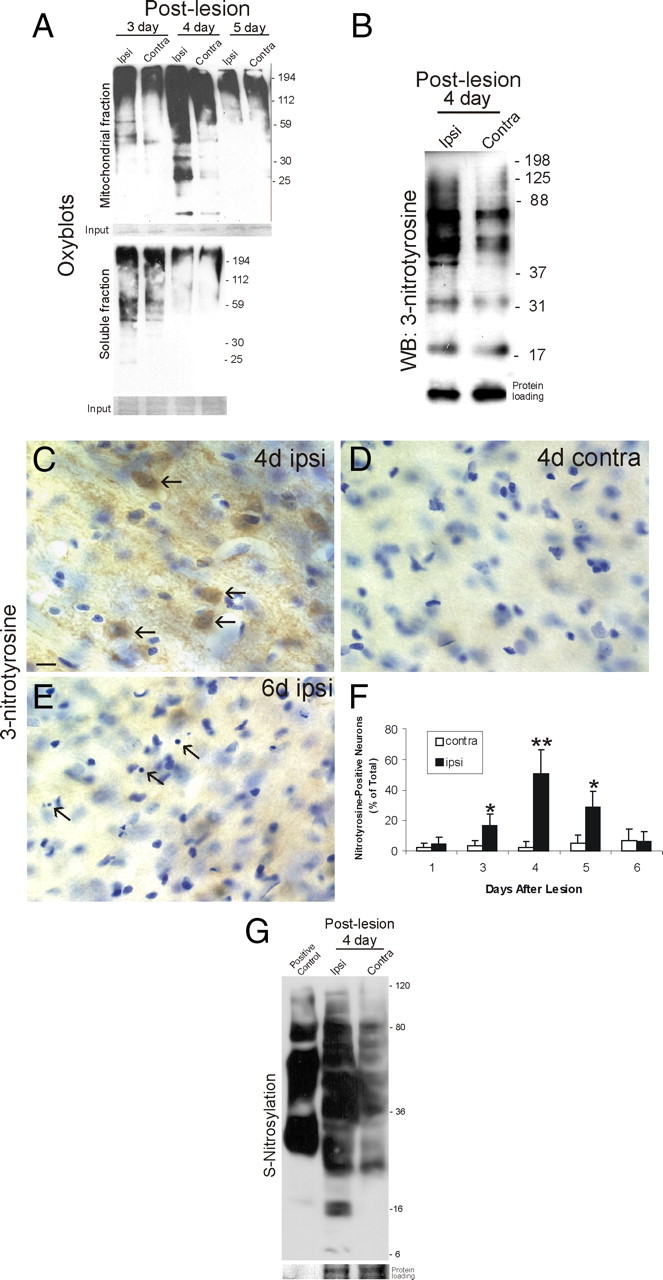
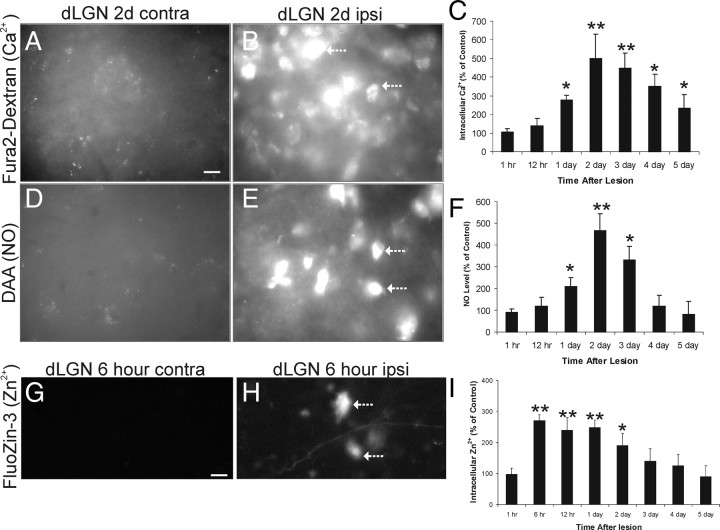
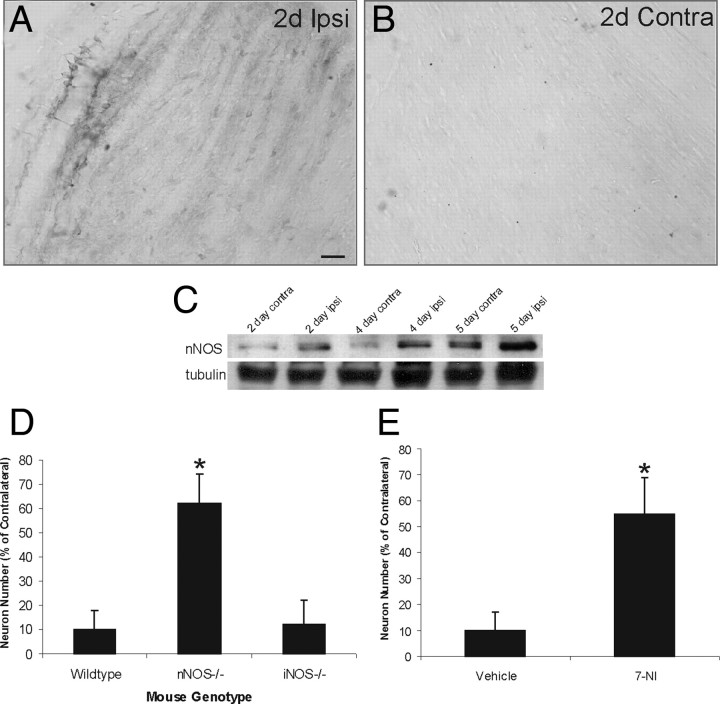
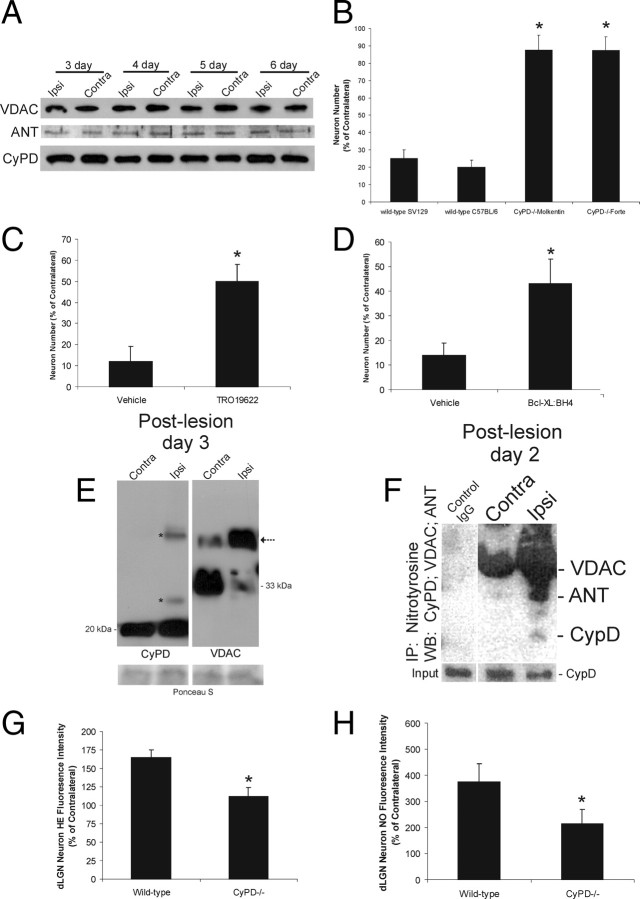
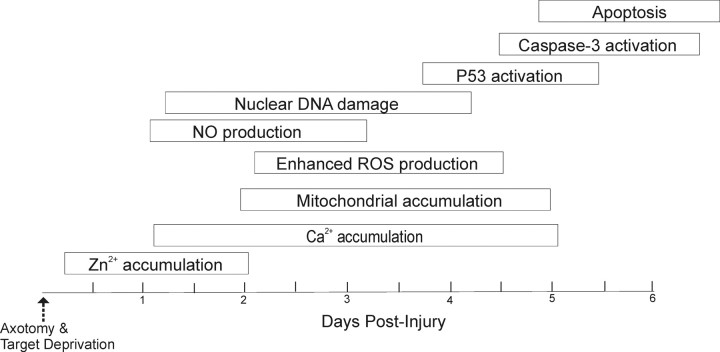
Ablation of mouse occipital cortex induces precisely timed and uniform p53-modulated and Bax-dependent apoptosis of thalamocortical projection neurons in the dorsal lateral geniculate nucleus (LGN) by 7 d after lesion. We tested the hypothesis that this neuronal apoptosis is initiated by oxidative stress and the mitochondrial permeability transition pore (mPTP). Preapoptotic LGN neurons accumulate mitochondria, Zn(2+) and Ca(2+), and generate higher levels of reactive oxygen species (ROS), including superoxide, nitric oxide (NO), and peroxynitrite, than LGN neurons with an intact cortical target. Preapoptosis of LGN neurons is associated with increased formation of protein carbonyls, protein nitration, and protein S-nitrosylation. Genetic deletion of nitric oxide synthase 1 (nos1) and inhibition of NOS1 with nitroindazole protected LGN neurons from apoptosis, revealing NO as a mediator. Putative components of the mPTP are expressed in mouse LGN, including the voltage-dependent anion channel (VDAC), adenine nucleotide translocator (ANT), and cyclophilin D (CyPD). Nitration of CyPD and ANT in LGN mitochondria occurs by 2 d after cortical injury. Chemical cross-linking showed that LGN neuron preapoptosis is associated with formation of CyPD and VDAC oligomers, consistent with mPTP formation. Mice without CyPD are rescued from neuron apoptosis as are mice treated with the mPTP inhibitors TRO-19622 (cholest-4-en-3-one oxime) and TAT-Bcl-X(L)-BH4. Manipulation of the mPTP markedly attenuated the early preapoptotic production of reactive oxygen/nitrogen species in target-deprived neurons. Our results demonstrate in adult mouse brain neurons that the mPTP functions to enhance ROS production and the mPTP and NO trigger apoptosis; thus, the mPTP is a target for neuroprotection in vivo.


Figures

Figure 1.
Figure 1.
Target-deprived dLGN neurons accumulate mitochondria and elevate production of ROS preapoptotically. A, B, Representative electron micrographs of dLGN neuron cell body profiles in cross-section showing the perikaryal distribution of mitochondria in a control target-intact neuron (A) and a target-deprived neuron (B) at 4 d after cortical ablation. Mitochondria (arrows), nucleus, and rough endoplasmic reticulum (RER) are identified. The target-deprived neuron has accumulated mitochondria (arrows), some of which are undergoing fission (B, top right inset). Scale bar: A, bottom left, 1.7 μm. C, Counts of mitochondrial numbers derived from serial electron micrographs of dLGN neuron perikarya with intact cortex (control) and ablated occipital cortex at 1, 2,4, 5, and 6 d after lesion. Values (n = 5 mice per group) are mean ± SD of 50 cells analyzed for each time point with significant increases seen at 2 d (*p < 0.05) and at 4 and 5 d (**p < 0.001) and a significant decrease seen at 7 d (+p < 0.05) compared with control. Insets show a control dLGN neuron (left) and a near end-stage apoptotic dLGN neuron (right) on the sixth day after target deprivation. Scale bars, 4.5 μm. D, Graph showing the volume of dLGN neurons cell bodies (represented as percentage of control) at 1, 3, 4, 5, 6, and 7 d after target deprivation. Values are mean ± SD of 50 cells analyzed for each time point with a significant increase seen at 4 d (*p < 0.05) and significant decreases seen at 6 d (+p < 0.05) and 7 d (++p < 0.001) compared with control. E, F, MitoTracker Red CM-H2XRos labeling of control contralateral (contra) and target-deprived ipsilateral (ipsi) dLGN neurons at 3 d after occipital cortex ablation (white arrows identify selected neurons with fluorescent labeling of mitochondria). G, Graph showing MitoTracker Red fluorescence intensity of dLGN neuron cell bodies (represented as percentage of control) at 1, 3, 4, 5, 6, and 7 d after target deprivation. Values (n = 6 mice per group) are mean ± SD of 50 cells analyzed for each time point with significant increases seen at 3 and 4 d (*p < 0.05) and significant decreases seen at 6 d (+p < 0.05) and 7 d (++p < 0.001) compared with control. H, I, HE labeling of control contralateral (contra) and target-deprived ipsilateral (ipsi) dLGN neurons at 3 d after occipital cortex ablation (white arrows identify selected neurons with fluorescent labeling). J, Graph showing HE fluorescence intensity of dLGN neuron cell bodies (represented as percentage of control) at 1, 3, 4, 5, 6, and 7 d after target deprivation. Values (n = 6 mice per group) are mean ± SD of 50 cells analyzed for each time point. Significant increases were seen at 3 and 4 d (*p < 0.05), and significant decreases were seen at 6 d (+p < 0.05) and 7 d (++p < 0.001) compared with control. K, L, DCF labeling of control contralateral (contra) and target-deprived ipsilateral (ipsi) dLGN neurons at 3 d after occipital cortex ablation (white arrows identify selected neurons with fluorescent labeling of mitochondria). M, Graph showing DCF fluorescence intensity of dLGN neuron cell bodies (represented as percentage of control) at 1, 3, 4, 5, 6, and 7 d after target deprivation. Values (n = 6 mice per group) are mean ± SD of 50 cells analyzed for each time point. Significant increases were seen at 3, 4, and 5 d (*p < 0.05), and a significant decrease was seen at 7 d (+p < 0.001) compared with control.
Figure 2.
Figure 2.
Preapoptotic dLGN neurons accumulate oxidative damage, nitrated proteins, and S-nitrosylated proteins. A, Oxyblot analysis of microdissected ipsilateral target-deprived and contralateral target-intact LGN after fractionation into mitochondrial (top blot) and soluble (bottom blot) protein fractions as described previously (Martin et al., 2003). Mitochondrial proteins (5 μg/lane) from ipsilateral LGN showed a modest increase in protein carbonyls at 3 d and then an abrupt robust transient accumulation of protein carbonyls at 4 d. Molecular weight standards (in kilodaltons) are shown at right. Soluble protein extracts from the same LGN samples used for mitochondrial extractions did not show differences between ipsilateral and contralateral. The result was reproduced in four different mice in each group. Equivalent inputs are shown by Ponceau S staining of membranes (shown at the bottom of each oxyblot). B, Western blot for 3-nitrotyrosine-immunoreactive proteins in ipsilateral and contralateral LGN total extracts at 4 d after occipital cortex ablation. The ipsilateral LGN showed a marked accumulation of nitrated proteins in the 40–125 kDa range. Molecular weight standards (in kilodaltons) are shown at right. Protein loading control is show at bottom. The result was reproduced in four different mice. C–E, Immunohistochemical localization of 3-nitrotyrosine immunoreactivity in the dLGN. Immunoperoxidase was used to visualize nitrated proteins using monoclonal antibody to 3-nitrotyrosine and DAB (brown) and then sections were counterstained with cresyl violet. A marked accumulation was seen in neurons in the ipsilateral dLGN at 4 d after target deprivation (C, arrows). The contralateral dLGN on the same section showed only faint labeling (D). At 6 d after target deprivation, end-stage apoptotic profiles became discernible (E, arrows), whereas 3-nitrotyrosine immunoreactivity dissipated. Scale bar: (in C) C–E, 12 μm. F, Graph showing number of 3-nitrotyrosine-positive dLGN neuron cell bodies at 1, 3, 4, 5, and 6 d after target deprivation. Values (n = 6 mice per group) are mean ± SD. Significant increases were seen at 3 d (*p < 0.05), 4 d (**p < 0.01), and 5 d (*p < 0.05) compared with contralateral control. G, S-Nitrosylation of proteins in LGN of mouse brain at 4 d after target deprivation. Protein S-nitrosylation was detected using the biotin switch method (Jaffrey and Snyder, 2001). The ipsilateral LGN showed a marked accumulation of nitrosylated proteins (3.5 μg of protein loaded in each lane). Molecular weight standards (in kilodaltons) are shown at right. Protein input is shown at bottom. The positive control for protein biotinylation was biotin-labeled IgG.
Figure 3.
Figure 3.
Early dysregulation of intracellular Ca2+, Zn2+, and NO in target-deprived dLGN neurons. A, B, Fura-2 AM-dextran labeling of control contralateral (contra) and target-deprived ipsilateral (ipsi) dLGN neurons at 2 d after occipital cortex ablation. Very faint fluorescent signal is seen in control neurons, whereas intense intracellular Ca2+ signal is seen in target-deprived neurons (arrows). Scale bar: (in A) A–E, 12 μm. C, Graph showing fura-2 AM-dextran fluorescence intensity of dLGN neuron cell bodies (represented as percentage of control) at 1 and 12 h (hr) and 1, 2, 3, 4, and 5 d after target deprivation. Values (n = 6 mice per group) are mean ± SD of 50 cells analyzed for each time point with indicated significant increases (*p < 0.05 or **p < 0.01) compared with control. D, E, DAA labeling of control contralateral (contra) and target-deprived ipsilateral (ipsi) dLGN neurons at 2 d after occipital cortex ablation. No fluorescent signal is seen in control neurons, whereas intense intracellular NO signal is seen in target-deprived neurons (arrows). F, Graph showing DAA fluorescence intensity of dLGN neuron cell bodies (represented as percentage of control) at 1 and 12 h (hr) and 1, 2, 3, 4, and 5 d after target deprivation. Values (n = 6 mice per group) are mean ± SD of 50 cells analyzed for each time point with indicated significant increases (*p < 0.05 or **p < 0.01) compared with control. G, H, FluoZin-3 labeling of control contralateral (contra) and target-deprived ipsilateral (ipsi) dLGN neurons at 6 h after occipital cortex ablation. No fluorescent signal is seen in control neurons, whereas intense intracellular Zn2+ signal is seen in target-deprived neurons (arrows). Scale bar: (in G) G, H, 12 μm. I, Graph showing FluoZin-3 fluorescence intensity of dLGN neuron cell bodies (represented as percentage of control) at 1, 6, and 12 h (hr) and 1, 2, 3, 4, and 5 d after target deprivation. Values (n = 3 mice per group) are mean ± SD of 50 cells analyzed for each time point with indicated significant increases (*p < 0.05 or **p < 0.01) compared with control.
Figure 4.
Figure 4.
nNOS mediates apoptosis of dLGN neurons induced by target deprivation. A, B, Immunohistochemistry showing the nNOS upregulation in ipsilateral (ipsi) dLGN at 2 d (2d) after target deprivation (A). Scale bar: (in A) A, B, 30 μm. Immunoreactivity for nNOS is low in the dLGN with an intact cortical target at 2 d (B). C, Western blot showing the nNOS upregulation in the ipsilateral versus contralateral LGN at 2, 4, and 5 d after target deprivation. Western blot reprobed for β-tubulin is shown for protein loading. D, Graph showing the number dLGN neurons in nNOS−/− and iNOS−/− mice at 7 d after occipital cortex ablation. Values are mean ± SD (n = 8 mice per genotype). The asterisk indicates significantly different from wild type (p < 0.01). E, Graph showing the number dLGN neurons at 7 d after occipital cortex ablation in wild-type mice treated daily (25 mg/kg, i.p.) with the nNOS inhibitor 3-bromo-7-nitroindazole (7-NI) or vehicle (peanut oil). Values are mean ± SD (n = 8 mice per group). The asterisk indicates significantly different from wild type (p < 0.01).
Figure 5.
Figure 5.
The mPTP drives apoptosis of dLGN neurons induced by target deprivation through increased ROS production and is associated with the formation of mPTP protein assemblies and nitration of core components. A, Western blot showing three core components of the mPTP (VDAC, ANT, and CyPD) in the ipsilateral versus contralateral LGN at 3, 4, 5, and 6 d after target deprivation. No major changes in the levels of monomeric proteins are evident under reducing conditions. B, Graph showing the number dLGN neurons at 7 d after occipital cortex ablation in CyPD−/− mice on two different genetic backgrounds. Values are mean ± SD (n = 10 mice per genotype). The asterisks indicate significantly different from wild type (p < 0.001). C, Graph showing the number dLGN neurons at 7 d after occipital cortex ablation in wild-type mice treated daily (10 μm, i.c.v.) with TRO-19622 or vehicle. Values are mean ± SD (n = 8 mice per group). The asterisk indicates significantly different from wild type (p < 0.01). D, Graph showing the number dLGN neurons at 7 d after occipital cortex ablation in wild-type mice treated daily (10 μm, i.c.v.) with TAT-Bcl-XL:BH4 or vehicle. Values are mean ± SD (n = 8 mice per group). The asterisk indicates significantly different from wild type (p < 0.01). E, Western blots for CyPD and VDAC in wild-type mouse LGN treated with chemical cross-linker at 3 d after unilateral target deprivation. Ipsilateral and contralateral LGN extracts of the same mouse are shown. Monomeric CyPD, detected at ∼20 kDa in comparable amounts, is seen in both contralateral and ipsilateral LGN, but higher molecular weight forms of CyPD (asterisks) are seen only in ipsilateral LGN. Protein loading in each lane is shown by Ponceau S staining of membrane (bottom). Monomeric VDAC is detected at ∼33 kDa. Monomeric VDAC predominates in the control contralateral LGN with a less abundant band immunoreactive for VDAC at ∼45 kDa. This higher molecular form of VDAC (arrow) predominates in the target-deprived LGN, whereas the monomer dissipates under cross-linking conditions. Protein loading in each lane is shown by Ponceau S staining of membrane (bottom). Equivalent lysate input is shown by CyPD immunoblot on ∼25% of the crude fraction used for immunoprecipitation. Negative control for immunoprecipitation of LGN extracts was normal preimmune IgG. F, Immunoprecipitation of nitrated proteins followed by Western blotting shows that CyPD and ANT are nitrated in the LGN by 2 d after target deprivation. Ipsilateral and contralateral LGN samples (250 μg protein) were immunoprecipitated with 3-nitrotyrosine monoclonal antibody (1 μg) and subjected to SDS-PAGE and sequential Western blotting for CyPD, ANT, and VDAC, respectively. G, Graph showing HE fluorescence intensity of dLGN neurons in wild-type and CyPD−/− mice at 3 d after target deprivation. Values (n = 4 mice per group) are mean ± SD (represented as percentage of contralateral) of 100 cells analyzed for each mouse. H, Graph showing DAA fluorescence intensity of dLGN neurons in wild-type and CyPD−/− mice at 3 d after target deprivation. Values (n = 4 mice per group) are mean ± SD (represented as percentage of contralateral) of 100 cells analyzed for each mouse.
Figure 6.
Figure 6.
Schematic diagram illustrating a possible sequence of events leading to neuronal apoptosis in our animal model. This neuronal cell death is highly synchronous and uniformly apoptotic. This scheme has been generated based on data from this study and other studies (Al-Abdulla and Martin, 1998; Martin et al., 2001, 2003). So far, the earliest preapoptotic event that we have detected is the intracellular accumulation of Zn2+, consistent with a previous finding (Land and Aizenman, 2005).

References

    1. Al-Abdulla NA, Martin LJ. Apoptosis of retrogradely degenerating neurons occurs in association with the accumulation of perikaryal mitochondria and oxidative damage to the nucleus. Am J Pathol. 1998;153:447–456. - PMC - PubMed
    1. Al-Abdulla NA, Martin LJ. Projection neurons and interneurons in the lateral geniculate nucleus undergo distinct forms of degeneration ranging from retrograde and transsynaptic apoptosis to transient atrophy after cortical ablation in rat. Neuroscience. 2002;115:7–14. - PubMed
    1. Al-Abdulla NA, Portera-Cailliau C, Martin LJ. Occipital cortex ablation in adult rat causes retrograde neuronal death in the lateral geniculate nucleus that resembles apoptosis. Neuroscience. 1998;86:191–209. - PubMed
    1. Anderson AJ, Su JH, Cotman CW. DNA damage and apoptosis in Alzheimer's disease: colocalization with c-Jun immunoreactivity, relationship to brain area, and effect of postmortem delay. J Neurosci. 1996;16:1710–1719. - PMC - PubMed
    1. Anglade P, Vyas S, Javoy-Agid F, Herrero MT, Michel PP, Marquez J, Mouatt-Prigent A, Ruberg M, Hirsch EC, Agid Y. Apoptosis and autophagy in nigral neurons of patients with Parkinson's disease. Histol Histopathol. 1997;12:25–31. - PubMed

Publication types

MeSH terms