. 2011 Jan 25;108(4):1699-704.
doi: 10.1073/pnas.1016114108. Epub 2011 Jan 5.

Ca2+-dependent structural rearrangements within Na+-Ca2+ exchanger dimers

Affiliations

Ca2+-dependent structural rearrangements within Na+-Ca2+ exchanger dimers

Scott A John et al. Proc Natl Acad Sci U S A. .

Abstract

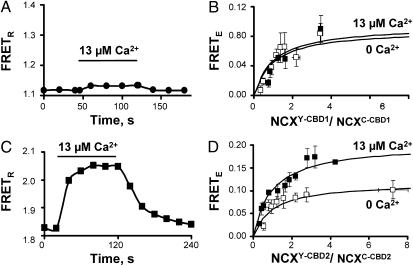
Cytoplasmic Ca(2+) is known to regulate Na(+)-Ca(2+) exchanger (NCX) activity by binding to two adjacent Ca(2+)-binding domains (CBD1 and CBD2) located in the large intracellular loop between transmembrane segments 5 and 6. We investigated Ca(2+)-dependent movements as changes in FRET between exchanger proteins tagged with CFP or YFP at position 266 within the large cytoplasmic loop. Data indicate that the exchanger assembles as a dimer in the plasma membrane. Addition of Ca(2+) decreases the distance between the cytoplasmic loops of NCX pairs. The Ca(2+)-dependent movements detected between paired NCXs were abolished by mutating the Ca(2+) coordination sites in CBD1 (D421A, E451A, and D500V), whereas disruption of the primary Ca(2+) coordination site in CBD2 (E516L) had no effect. Thus, the Ca(2+)-induced conformational changes of NCX dimers arise from the movement of CBD1. FRET studies of CBD1, CBD2, and CBD1-CBD2 peptides displayed Ca(2+)-dependent movements with different apparent affinities. CBD1-CBD2 showed a Ca(2+)-dependent phenotype mirroring full-length NCX but distinct from both CBD1 and CBD2.


Conflict of interest statement

The authors declare no conflict of interest.

Figures

Fig. 1.
Fig. 1.
NCX undergoes Ca2+-dependent conformational changes. (A) Secondary structure of the fluorescent-tagged exchanger illustrating the relative position of the two Ca2+–binding domains (CBD1 and CBD2) and fluorophores (FP). Small spheres indicate bound Ca2+. (B) Effect of changes in intracellular Ca2+ on CFP (□) and YFP (■) emissions (Left) and corresponding FRETR (Right) after coexpression of NCXC and NCXY. (C) Changes in normalized FRETR versus free [Ca2+] for NCXC + NCXY. FRETR values were normalized to their maximum and fitted to a single Hill function (Kh = 40 nM and Hill coefficient =1.8).
Fig. 2.
Fig. 2.
NCX exists as dimer in the plasma membrane. (A) Dependence of FRETE on NCXY expression (measured as fluorescence emission intensity, a.u.) at a constant NCXC expression level and in presence of 13 μM Ca2+. Points were fitted to FRETE = (FRETmax * FYFP)/FYFP + K, where FRETmax is the maximal FRETE, FYFP is YFP emission intensity, and K is analogous to a dissociation constant (19). F test comparison between hyperbolic and linear regressions indicates that a nonlinear model best fits the points (P < 0.0001). (B) FRETE versus protein concentration measured as the sum of YFP (before bleaching) and CFP (after YFP bleaching) fluorescence intensity. FRETE was measured in the absence of Ca2+ from FluoPMS expressing a constant ratio of NCXY to NCXC of 0.50 ± 0.03 (n = 20) or 4.3 ± 0.2 (n = 18) in absence of Ca2+ and 4.3 ± 0.1 (n = 28) in presence of 13 μM Ca2+. The R2 values are 0.086, 0.00002, and 0.01, respectively. (C) Plot of FRETE as function of the NCXY/NCXC concentration ratio in absence or presence of 13 μM Ca2+. Points were fitted to a hyperbole as described in the Materials and Methods and in ref. . Each point is the average of 4–12 measurements. (D) Comparison between the experimental data shown in Fig. 2C (normalized to their maxima) and modeled FRETE curves for dimer, trimer, and tetramer according to [(a + d)nandn]/[(a + d)nandn + ndn] (24), where n is the number of molecule(s) in the oligomers, a is the number of acceptors, and d is the number of donors. The SDs of the vertical distances of the points from the lines describing the dimer, trimer, or tetramer models are 0.08, 0.18, and 0.24 (0 Ca2+) and 0.08, 0.17, and 0.24 (13 μM Ca2+).
Fig. 3.
Fig. 3.
Mutations within CBD1 abolish Ca2+-dependent conformational changes. (A and B) Effect of intracellular Ca2+ on changes in FRETR and FRETE between CFP- and YFP-tagged exchangers carrying the mutations D421A, E451A, and D500V (NCXC–CBD1 + NCXY-CBD1). Mutations within CBD1 abolished Ca2+-dependent FRET changes. (C and D) FRETR and FRETE measurements from fluorescent-tagged exchangers with E516L in CBD2 (NCXC–CBD2 + NCXY-CBD2). Note the increases in FRETR and FRETE upon addition of cytoplasmic Ca2+.
Fig. 4.
Fig. 4.
Cytoplasmic Ca2+ triggers movement in the isolated Ca2+-binding domains. (A–C) Effect of Ca2+ on FRETR signals generated by CCBD1Y (A), CCBD2Y (B), and CCBD12Y (C) in FluoPMS. Note the lower Ca2+ concentrations required to activate movements in CBD12. Images were acquired every 10 s. (D) Changes in normalized FRETR value versus free [Ca2+]. Points, which are averaged between four and six experiments, were fitted to a Hill function. Kh values are 0.20 μM, 12 μM, and 0.010 μM for CBD1, CBD2, and CBD12. Average Kh values obtained from the single experiments are (in μM) 0.19 ± 0.01 (n = 4), 12 ± 0.01 (n = 6), and 0.014 ± 0.01 (n = 4), respectively. For CBD12, only the high Ca2+ affinity component was analyzed because the movements associated with higher Ca2+ concentrations were too small for accurate analysis. (E) Average FRETE values in the absence and presence of 13 μM Ca2+ for CBD1 and CBD12 and 139 μM Ca2+ for CBD2. Values are 0.35 ± 0.01 and 0.23 ± 0.01 for CBD1, 0.184 ± 0.003 and 0.162 ± 0.003 for CBD2, and 0.114 ± 0.003 and 0.090 ± 0.004 for CBD12, respectively. CCBD1Y-L is a lengthened construct consisting of residues 371–508, and CCBD12Y-CBD1 is CCBD12Y with mutations D421A, E451A, and D500V in CBD1. Values are 0.28 ± 0.01 and 0.23 ± 0.01 for CCBD1Y-L and 0.14 ± 0.01 and 0.13 ± 0.01 for CCBD12Y-CBD1. Number of experiments is indicated within each bar.
Fig. 5.
Fig. 5.
Removal of Ca2+ causes a slow conformational change in CBD12 and in the full-length NCX. (AC) FRETR changes upon removal of regulatory Ca2+ for the indicated constructs. Images were acquired every 200 or 500 ms. (D) Summary of time constants for FRETR changes upon removal of Ca2+ for CBD12 and NCX. #Values for the individual CBDs represent an upper limit and cannot be accurately measured because of our limited frame rate (5 Hz). Faster kinetics are likely to occur as previously reported (26, 27).

References

    1. Philipson KD, et al. The Na+/Ca2+ exchange molecule: An overview. Ann N Y Acad Sci. 2002;976:1–10. - PubMed
    1. Hilgemann DW, Collins A, Matsuoka S. Steady-state and dynamic properties of cardiac sodium-calcium exchange. Secondary modulation by cytoplasmic calcium and ATP. J Gen Physiol. 1992;100:933–961. - PMC - PubMed
    1. Hilgemann DW, Matsuoka S, Nagel GA, Collins A. Steady-state and dynamic properties of cardiac sodium-calcium exchange. Sodium-dependent inactivation. J Gen Physiol. 1992;100:905–932. - PMC - PubMed
    1. Besserer GM, et al. The second Ca2+-binding domain of the Na+ Ca2+ exchanger is essential for regulation: Crystal structures and mutational analysis. Proc Natl Acad Sci USA. 2007;104:18467–18472. - PMC - PubMed
    1. Ottolia M, Nicoll DA, Philipson KD. Roles of two Ca2+-binding domains in regulation of the cardiac Na+-Ca2+ exchanger. J Biol Chem. 2009;284:32735–32741. - PMC - PubMed

Publication types

MeSH terms

LinkOut - more resources