. 2010 Nov 29;5(11):e15531.
doi: 10.1371/journal.pone.0015531.

Functional and pathogenic differences of Th1 and Th17 cells in experimental autoimmune encephalomyelitis

Affiliations

Functional and pathogenic differences of Th1 and Th17 cells in experimental autoimmune encephalomyelitis

Helena S Domingues et al. PLoS One. .

Abstract

Background: There is consensus that experimental autoimmune encephalomyelitis (EAE) can be mediated by myelin specific T cells of Th1 as well as of Th17 phenotype, but the contribution of either subset to the pathogenic process has remained controversial. In this report, we compare functional differences and pathogenic potential of "monoclonal" T cell lines that recognize myelin oligodendrocyte glycoprotein (MOG) with the same transgenic TCR but are distinguished by an IFN-γ producing Th1-like and IL-17 producing Th17-like cytokine signature.

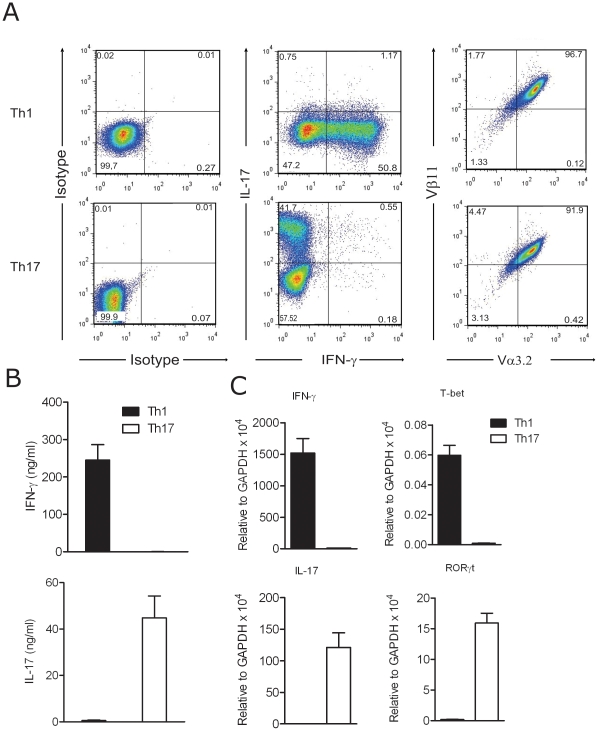
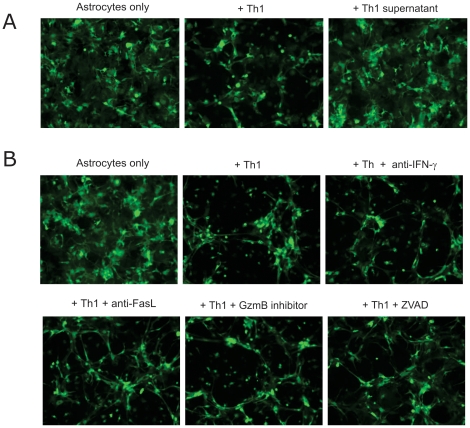
Methods and findings: CD4+ T cell lines were derived from the transgenic mouse strain 2D2, which expresses a TCR recognizing MOG peptide 35-55 in the context of I-A(b). Adoptive transfer of Th1 cells into lymphopenic (Rag2⁻/⁻) recipients, predominantly induced "classic" paralytic EAE, whereas Th17 cells mediated "atypical" ataxic EAE in approximately 50% of the recipient animals. Combination of Th1 and Th17 cells potentiated the encephalitogenicity inducing classical EAE exclusively. Th1 and Th17 mediated EAE lesions differed in their composition but not in their localization within the CNS. While Th1 lesions contained IFN-γ, but no IL-17 producing T cells, the T cells in Th17 lesions showed plasticity, substantially converting to IFN-γ producing Th1-like cells. Th1 and Th17 cells differed drastically by their lytic potential. Th1 but not Th17 cells lysed autoantigen presenting astrocytes and fibroblasts in vitro in a contact-dependent manner. In contrast, Th17 cells acquired cytotoxic potential only after antigenic stimulation and conversion to IFN-γ producing Th1 phenotype.

Conclusions: Our data demonstrate that both Th1 and Th17 lineages possess the ability to induce CNS autoimmunity but can function with complementary as well as differential pathogenic mechanisms. We propose that Th17-like cells producing IL-17 are required for the generation of atypical EAE whereas IFN-γ producing Th1 cells induce classical EAE.


Conflict of interest statement

Competing Interests: The authors have declared that no competing interests exist.

Figures

Figure 1
Figure 1. MOG-specific Th1 and Th17 cell differentiation.
A. T cells from 2D2 mice were activated under Th1 and Th17 polarizing conditions. Vα3.2 and Vβ11 transgenic TCR chains, as well as intracellular IL-17 and IFN-γ cytokine expression was assessed by FACS. Data shown are gated in the CD4+ population. B. IFN-γ and IL-17 cytokines from culture supernatants of Th1 and Th17 polarized cells were quantified by ELISA. C. IFN-γ, Tbet, IL-17 and RORγt gene expression was quantified by real-time PCR of Th1 and Th17 polarized cells. Data shown are representative (A) or a mean of a minimum of 5 experiments. Error bars indicate SEM (B and C).
Figure 2
Figure 2. Comparative characterization of MOG-specific Th1, Th2 and Th17 cells.
T cells from 2D2 mice were activated under Th1 and Th17 polarizing conditions. A. IL-4, IL-5, IL-10 and GM-CSF cytokines from culture supernatants of Th1, Th2 and Th17 polarized cells were quantified by ELISA (A and B). B. GM-CSF gene expression of Th1 and Th17 polarized cells was quantified by real-time PCR. C. CD25 and CD62L surface expression was assessed by FACS and represent the mean percentage of positive cells in the CD4+ population; **p<0.01; ***p<0.001. D. Antigen specific proliferation of differentiated Th1 and Th17 cells with titrated concentrations of rMOG was measured by quantification of radioactive 3H-thymidine uptake. *p<0.05; **p<0.01. Data shown are expressed as mean ± SEM of 3 (A, B), 9 (C) or representative of 3 (D) independent experiments.
Figure 3
Figure 3. Adoptive transfer EAE with polarized Th1 and Th17 cells.
Th1 and Th17 polarized cells were adoptively transferred to Rag2−/− recipient mice, either alone or in combination or with anti-IFN-γ treatment as indicated. Recipient mice were scored for EAE disease. A. Shown is the percentage of EAE incidence in the different recipient mice. ***p<0.0001; Th1+Th17 vs. all other conditions. B. EAE clinical scores in the different recipient mice. Data is represented as mean ± SD. C. Incidence of classical and atypical EAE phenotype in different T cell transfers. Shown is the percentage of classical vs. atypical EAE incidence in the different recipient mice. Th1: n = 29; Th17: n = 40; Th1+Th17: n = 16; Th17+ anti-IFN-γ: n = 11.
Figure 4
Figure 4. Plasticity of Th17 cells in adoptive transfer EAE.
Th1, Th17, Th1+Th17 cells or Th17 cells and anti-IFN-γ antibodies were adoptively transferred into Rag2−/− mice. A. EAE sick mice with classical EAE, minimum score of 3 were sacrificed, and brain and spleen were removed. Immune cells were isolated and characterized for IFN-γ and IL-17 expression by intracellular FACS staining. Data shown is gated in the CD4+ population and is representative of a minimum of 5 animals analyzed per group. B. Expression of IFN-γ and IL-17 in the brain from EAE sick mice was analyzed by real time PCR. Rag2−/− control: n = 7; Th1: n = 7; Th17: n = 10; Th1+Th17: n = 5; Th17+anti-IFN-γ: n = 6. Data are represented as mean ± SEM. *p<0.05; ***p<0.0001.
Figure 5
Figure 5. Cytotoxic molecules expression by Th1 and Th17 cells.
T cells from 2D2 mice were activated under Th1 and Th17 polarizing conditions. Expression of granzyme B, Fas-L and perforin in naive T cells (n = 4), Th1 (n = 6) and Th17 cells (n = 7) were measured by real time PCR. The data is represented as mean ± SEM.
Figure 6
Figure 6. Cytotoxic potential of Th1 and Th17 cells towards astrocytes.
2D2 MOG-specific T cells were polarized in Th1 and Th17 conditions and co-cultured in duplicates with activated astrocytes as described in methods. A. MHC class II expression on astrocytes was analysed by FACS. B. GFP-labeled astrocytes were co-cultured with Th1 or Th17 cells in the presence of isotype control or anti-MHC class II antibodies. Cells were tracked every 30 minutes by fluorescent time-lapse microscopy. Shown is the snap-shot fluorescent picture after 48 h co-culture. Magnification: 10×. C. Quantification of the fluorescent area (surviving cells) every 6 hours in the conditions shown in B. The values were normalized to that of control (astrocytes only). D. IL-17 and IFN-γ levels were measured in the supernatants at 48 h after the co-culture by ELISA. Data shown are representative of minimum 3 experiments. *p<0.05; ns-not significant.
Figure 7
Figure 7. Effect of blockade of cytotoxic molecules on Th1 mediated astrocyte cytotoxicity.
2D2 MOG-specific Th1 cells were co-cultured in duplicates for 48 hours with astrocytes in the presence or absence of the Th1 culture supernatant (A), anti-IFN-γ antibody, anti-FasL antibody, Granzyme B (GzmB) inhibitor and the pan-caspase inhibitor ZVAD (B). Cells were tracked every 30 minutes by fluorescent time-lapse microscopy. Shown is the snap-shot fluorescent picture at the end of the culture period and is representative of minimum 2 experiments.
Figure 8
Figure 8. Cytotoxic potential of Th1 and Th17 cells towards FT7.1 cells.
2D2 MOG-specific T cells were polarized in Th1 and Th17 conditions and co-cultured in duplicates with FT7.1 cells as described in methods. A. MHC class II expression on FT7.1 cells was analysed by FACS. B. GFP-labeled FT7.1 cells were co-cultured with Th1 or Th17 cells in the presence of isotype control or anti-MHC class II antibodies. Cells were tracked every 30 minutes by fluorescent time-lapse microscopy. Shown is the snap-shot fluorescent picture after 48 h co-culture. Magnification: 10×. C. Quantification of the fluorescent area (surviving cells) every 6 hours in the conditions shown in B. The values were normalized to that of control (FT7.1 cells only). D. IL-17 and IFN-γ levels were measured in the supernatants at 48 h after the co-culture by ELISA. Data shown are representative of minimum 3 experiments. ns-not significant.

References

    1. Ferber I, Brocke S, Taylor-Edwards C, Ridgway W, Dinisco C, et al. Mice with a disrupted IFN-γ gene are susceptible to the induction of experimental autoimmune encephalomyelitis (EAE). J Immunol. 1996;156:5–7. - PubMed
    1. Becher B, Durell BG, Noelle RJ. Experimental autoimmune encephalitis and inflammation in the absence of interleukin-12. J Clin Invest. 2002;110:493–497. - PMC - PubMed
    1. Willenborg DO, Fordham SA, Bernard CCA, Cowden WB, Ramshaw IA. IFN-γ plays a critical down-regulatory role in the induction and effector phase of myelin oligodendrocyte glycoprotein-induced autoimmune encephalomyelitis. J Immunol. 1996;157:3223–3227. - PubMed
    1. Zhang G-X, Gran B, Yu S, Li J, Siglienti I, et al. Induction of experimental autoimmune encephalomyelitis in IL-12 receptor-2-deficient mice: IL-12 responsiveness is not required in the pathogenesis of inflammatory demyelination in the central nervous system. J Immunol. 2003;170:2153–2160. - PubMed
    1. Gran B, Zhang G-X, Yu S, Chen X-H, Ventura ES, et al. IL-12p35-deficient mice are susceptible to experimental autoimmune encephalomyelitis: Evidence for redundancy in the IL-12 system in the induction of central nervous system autoimmune demyelination. J Immunol. 2002;169:7104–7110. - PubMed

Publication types

MeSH terms