

Scaling up the 2010 World Health Organization HIV Treatment Guidelines in resource-limited settings: a model-based analysis
- PMID: 21209794
- PMCID: PMC3014084
- DOI: 10.1371/journal.pmed.1000382
Scaling up the 2010 World Health Organization HIV Treatment Guidelines in resource-limited settings: a model-based analysis
Abstract
Background: The new 2010 World Health Organization (WHO) HIV treatment guidelines recommend earlier antiretroviral therapy (ART) initiation (CD4<350 cells/µl instead of CD4<200 cells/µl), multiple sequential ART regimens, and replacement of first-line stavudine with tenofovir. This paper considers what to do first in resource-limited settings where immediate implementation of all of the WHO recommendations is not feasible.
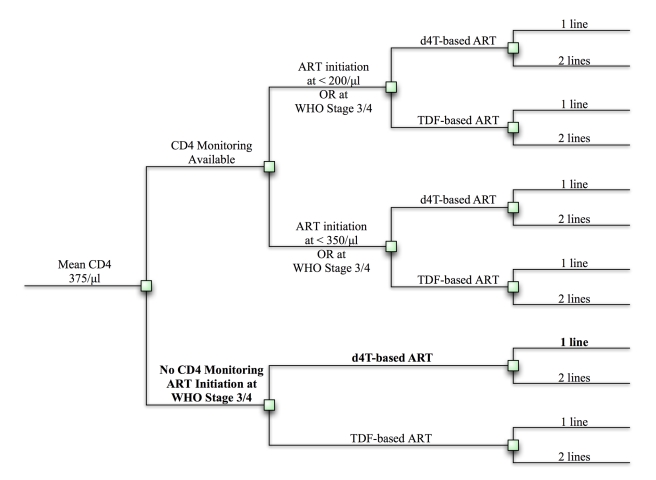
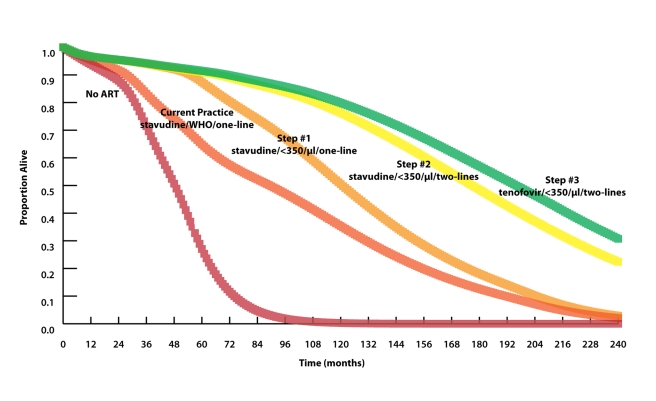
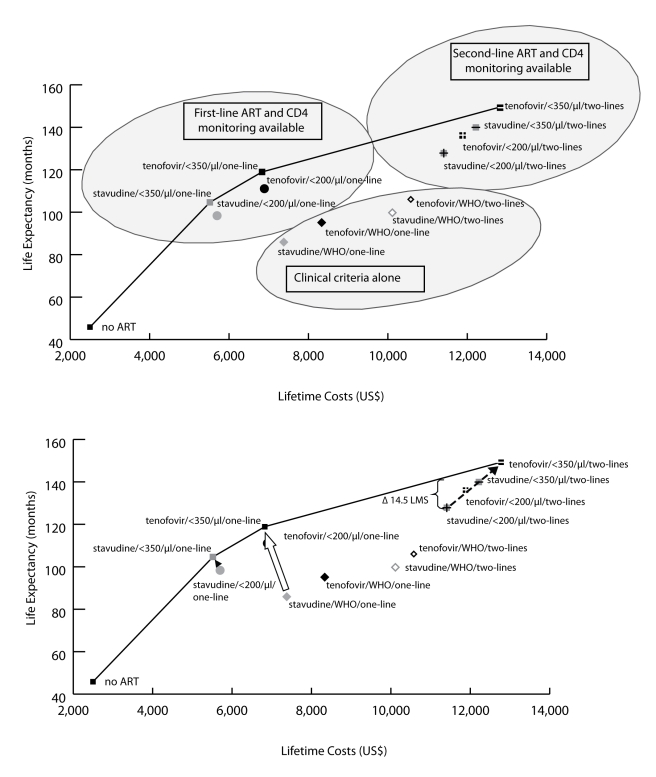
Methods and findings: We use a mathematical model and local input data to project clinical and economic outcomes in a South African HIV-infected cohort (mean age = 32.8 y, mean CD4 = 375/µl). For the reference strategy, we assume that all patients initiate stavudine-based ART with WHO stage III/IV disease and receive one line of ART (stavudine/WHO/one-line). We rank-in survival, cost-effectiveness, and equity terms-all 12 possible combinations of the following: (1) stavudine replacement with tenofovir, (2) ART initiation (by WHO stage, CD4<200 cells/µl, or CD4<350 cells/µl), and (3) one or two regimens, or lines, of available ART. Projected life expectancy for the reference strategy is 99.0 mo. Considering each of the guideline components separately, 5-y survival is maximized with ART initiation at CD4<350 cells/µl (stavudine/<350/µl/one-line, 87% survival) compared with stavudine/WHO/two-lines (66%) and tenofovir/WHO/one-line (66%). The greatest life expectancies are achieved via the following stepwise programmatic additions: stavudine/<350/µl/one-line (124.3 mo), stavudine/<350/µl/two-lines (177.6 mo), and tenofovir/<350/µl/two-lines (193.6 mo). Three program combinations are economically efficient: stavudine/<350/µl/one-line (cost-effectiveness ratio, US$610/years of life saved [YLS]), tenofovir/<350/µl/one-line (US$1,140/YLS), and tenofovir/<350/µl/two-lines (US$2,370/YLS).
Conclusions: In settings where immediate implementation of all of the new WHO treatment guidelines is not feasible, ART initiation at CD4<350 cells/µl provides the greatest short- and long-term survival advantage and is highly cost-effective.
Conflict of interest statement
RPW, XA, and RW participated in the World Health Organization Guidelines 2009 revision process, including the Peer Review Panel (XA) and Review Meeting 14–16 October, 2009, Geneva, Switzerland (RPW and RW).
Figures
References
-
- World Health Organization. WHO HIV/AIDS Programme: Antiretroviral therapy for HIV infection in adults and adolescents: recommendations for a public health approach. 2006 revision. 2006. Available: http://www.who.int/hiv/pub/guidelines/artadultguidelines.pdf. Accessed 14 December 2009. - PubMed
-
- World Health Organization. Antiretroviral therapy for HIV infection in adults and adolescents: recommendations for a public health approach. 2010 revision. 2010. Available: http://whqlibdoc.who.int/publications/2010/9789241599764_eng.pdf. Accessed 3 August 2010. - PubMed
-
- United States Department of Health and Human Services. Guidelines for the use of antiretroviral agents in HIV-1-infected adults and adolescents. 2009 December 1. Available: http://aidsinfo.nih.gov/contentfiles/AdultandAdolescentGL.pdf. Accessed 14 December 2009.
-
- European AIDS Clinical Society. Guidelines: clinical management and treatment of HIV infected adults in Europe. 2009 November. Available: http://www.europeanaidsclinicalsociety.org/guidelines.asp. Accessed 16 December 2009.
-
- World Health Organization. Towards universal access: Scaling up priority HIV/AIDS interventions in the health sector. 2009. Progress report 2009. Available: http://www.who.int/hiv/pub/tuapr_2009_en.pdf. Accessed 14 December 2009.
Publication types
MeSH terms
Substances
Grants and funding
LinkOut - more resources
Full Text Sources
Medical
Research Materials
